Lab: Experimental Study Design
advertisement
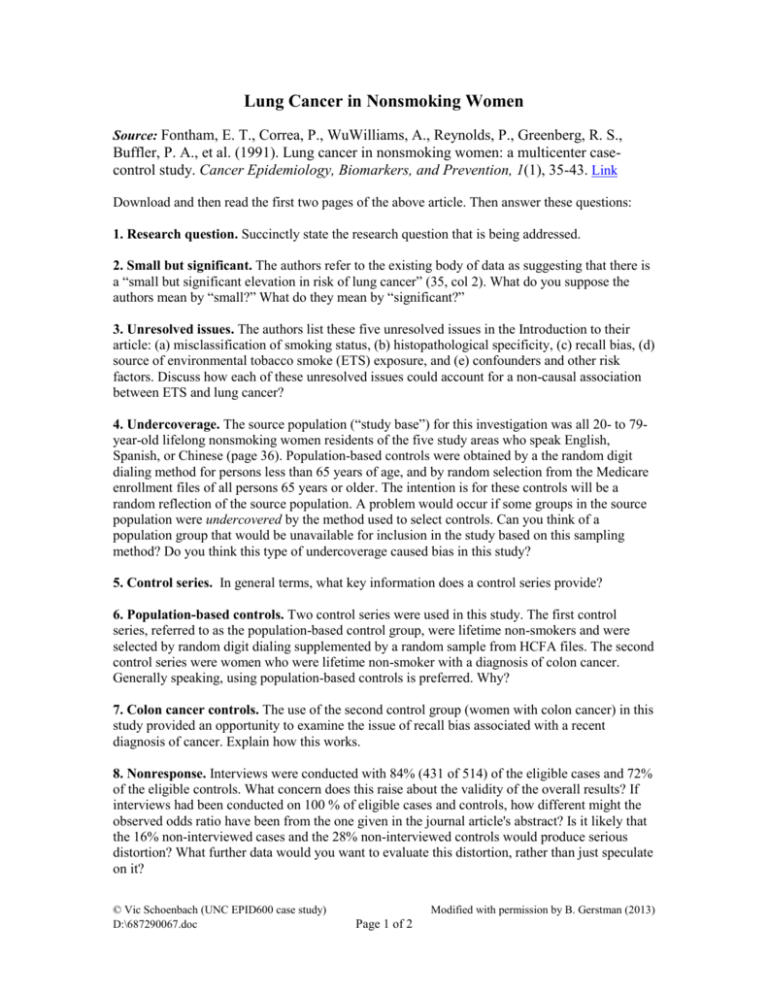
Lung Cancer in Nonsmoking Women Source: Fontham, E. T., Correa, P., WuWilliams, A., Reynolds, P., Greenberg, R. S., Buffler, P. A., et al. (1991). Lung cancer in nonsmoking women: a multicenter casecontrol study. Cancer Epidemiology, Biomarkers, and Prevention, 1(1), 35-43. Link Download and then read the first two pages of the above article. Then answer these questions: 1. Research question. Succinctly state the research question that is being addressed. 2. Small but significant. The authors refer to the existing body of data as suggesting that there is a “small but significant elevation in risk of lung cancer” (35, col 2). What do you suppose the authors mean by “small?” What do they mean by “significant?” 3. Unresolved issues. The authors list these five unresolved issues in the Introduction to their article: (a) misclassification of smoking status, (b) histopathological specificity, (c) recall bias, (d) source of environmental tobacco smoke (ETS) exposure, and (e) confounders and other risk factors. Discuss how each of these unresolved issues could account for a non-causal association between ETS and lung cancer? 4. Undercoverage. The source population (“study base”) for this investigation was all 20- to 79year-old lifelong nonsmoking women residents of the five study areas who speak English, Spanish, or Chinese (page 36). Population-based controls were obtained by a the random digit dialing method for persons less than 65 years of age, and by random selection from the Medicare enrollment files of all persons 65 years or older. The intention is for these controls will be a random reflection of the source population. A problem would occur if some groups in the source population were undercovered by the method used to select controls. Can you think of a population group that would be unavailable for inclusion in the study based on this sampling method? Do you think this type of undercoverage caused bias in this study? 5. Control series. In general terms, what key information does a control series provide? 6. Population-based controls. Two control series were used in this study. The first control series, referred to as the population-based control group, were lifetime non-smokers and were selected by random digit dialing supplemented by a random sample from HCFA files. The second control series were women who were lifetime non-smoker with a diagnosis of colon cancer. Generally speaking, using population-based controls is preferred. Why? 7. Colon cancer controls. The use of the second control group (women with colon cancer) in this study provided an opportunity to examine the issue of recall bias associated with a recent diagnosis of cancer. Explain how this works. 8. Nonresponse. Interviews were conducted with 84% (431 of 514) of the eligible cases and 72% of the eligible controls. What concern does this raise about the validity of the overall results? If interviews had been conducted on 100 % of eligible cases and controls, how different might the observed odds ratio have been from the one given in the journal article's abstract? Is it likely that the 16% non-interviewed cases and the 28% non-interviewed controls would produce serious distortion? What further data would you want to evaluate this distortion, rather than just speculate on it? © Vic Schoenbach (UNC EPID600 case study) D:\687290067.doc Modified with permission by B. Gerstman (2013) Page 1 of 2 9. Education level as a risk factor. The main “exposure variable” in this study is ETS. However, many other potential risk factors were also studied. Use the data on Education in Table 4 of the journal article to calculate the odds ratio of “less than high school” and lung cancer in nonsmoking women. Use the population controls as the control group. Let the exposed group be women with less than high school education. Let the nonexposed group be women with some college, college, and graduate education. Construct a 2-by-2 table with the data, as defined. Calculate the OR by hand. Interpret the results. Note: There is a typographical error in Table 4. The top of the first column (the number of lung cancer cases) should be 420, not 240. This won’t affect the calculations in this problem. 10. Education level as a risk factor, part 2. Use OpenEpi.com or WinPEPI to calculate a 95% confidence interval and P-value for the data from question 9. Interpret these results. 11. Different types of lung cancer. Let us return to the main topic of this article: the association between primary bronchial carcinoma (“lung cancer”) and ETS. Note that there are several varieties of lung cancer: adenocarcinoma, large cell carcinoma, squamous cell carcinoma, small cell carcinoma, and other (see p 37, c2 for the distribution of case types). In Table 5 of the journal article, the adjusted odds ratio for lung carcinomas and ETS obtained with the population controls was 1.29 (0.99, 1.69). Restricting the outcome to adenocarcinoma (only) yields an adjusted odds ratio of 1.47 (1.08, 2.01). How do you interpret this finding? © Vic Schoenbach (UNC EPID600 case study) D:\687290067.doc Modified with permission by B. Gerstman (2013) Page 2 of 2
