Expected value handout - University of Warwick
advertisement
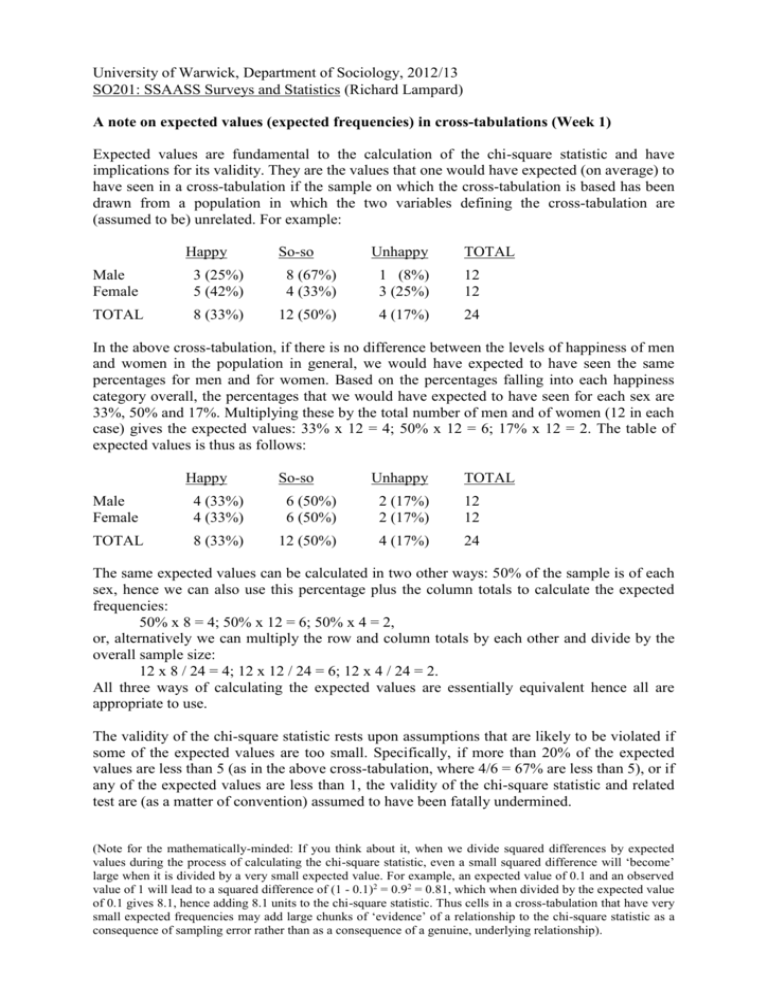
University of Warwick, Department of Sociology, 2012/13 SO201: SSAASS Surveys and Statistics (Richard Lampard) A note on expected values (expected frequencies) in cross-tabulations (Week 1) Expected values are fundamental to the calculation of the chi-square statistic and have implications for its validity. They are the values that one would have expected (on average) to have seen in a cross-tabulation if the sample on which the cross-tabulation is based has been drawn from a population in which the two variables defining the cross-tabulation are (assumed to be) unrelated. For example: Happy So-so Unhappy TOTAL Male Female 3 (25%) 5 (42%) 8 (67%) 4 (33%) 1 (8%) 3 (25%) 12 12 TOTAL 8 (33%) 12 (50%) 4 (17%) 24 In the above cross-tabulation, if there is no difference between the levels of happiness of men and women in the population in general, we would have expected to have seen the same percentages for men and for women. Based on the percentages falling into each happiness category overall, the percentages that we would have expected to have seen for each sex are 33%, 50% and 17%. Multiplying these by the total number of men and of women (12 in each case) gives the expected values: 33% x 12 = 4; 50% x 12 = 6; 17% x 12 = 2. The table of expected values is thus as follows: Happy So-so Unhappy TOTAL Male Female 4 (33%) 4 (33%) 6 (50%) 6 (50%) 2 (17%) 2 (17%) 12 12 TOTAL 8 (33%) 12 (50%) 4 (17%) 24 The same expected values can be calculated in two other ways: 50% of the sample is of each sex, hence we can also use this percentage plus the column totals to calculate the expected frequencies: 50% x 8 = 4; 50% x 12 = 6; 50% x 4 = 2, or, alternatively we can multiply the row and column totals by each other and divide by the overall sample size: 12 x 8 / 24 = 4; 12 x 12 / 24 = 6; 12 x 4 / 24 = 2. All three ways of calculating the expected values are essentially equivalent hence all are appropriate to use. The validity of the chi-square statistic rests upon assumptions that are likely to be violated if some of the expected values are too small. Specifically, if more than 20% of the expected values are less than 5 (as in the above cross-tabulation, where 4/6 = 67% are less than 5), or if any of the expected values are less than 1, the validity of the chi-square statistic and related test are (as a matter of convention) assumed to have been fatally undermined. (Note for the mathematically-minded: If you think about it, when we divide squared differences by expected values during the process of calculating the chi-square statistic, even a small squared difference will ‘become’ large when it is divided by a very small expected value. For example, an expected value of 0.1 and an observed value of 1 will lead to a squared difference of (1 - 0.1)2 = 0.92 = 0.81, which when divided by the expected value of 0.1 gives 8.1, hence adding 8.1 units to the chi-square statistic. Thus cells in a cross-tabulation that have very small expected frequencies may add large chunks of ‘evidence’ of a relationship to the chi-square statistic as a consequence of sampling error rather than as a consequence of a genuine, underlying relationship).
