3. The Generalized Logistic Model
advertisement
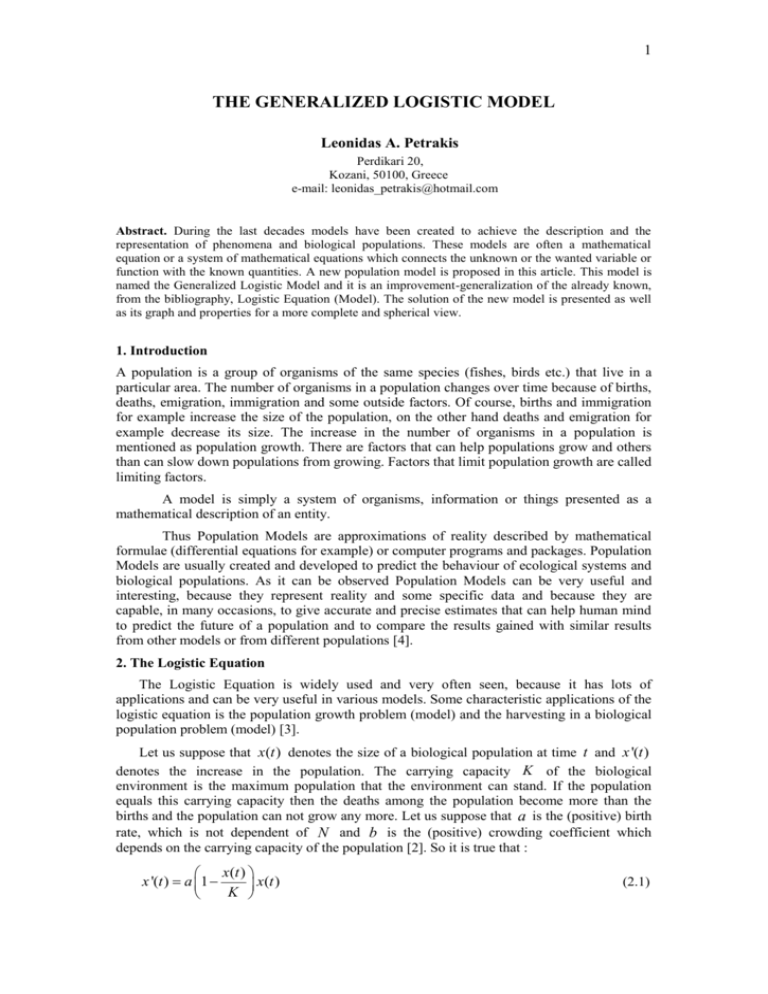
1 THE GENERALIZED LOGISTIC MODEL Leonidas A. Petrakis Perdikari 20, Kozani, 50100, Greece e-mail: leonidas_petrakis@hotmail.com Abstract. During the last decades models have been created to achieve the description and the representation of phenomena and biological populations. These models are often a mathematical equation or a system of mathematical equations which connects the unknown or the wanted variable or function with the known quantities. A new population model is proposed in this article. This model is named the Generalized Logistic Model and it is an improvement-generalization of the already known, from the bibliography, Logistic Equation (Model). The solution of the new model is presented as well as its graph and properties for a more complete and spherical view. 1. Introduction A population is a group of organisms of the same species (fishes, birds etc.) that live in a particular area. The number of organisms in a population changes over time because of births, deaths, emigration, immigration and some outside factors. Of course, births and immigration for example increase the size of the population, on the other hand deaths and emigration for example decrease its size. The increase in the number of organisms in a population is mentioned as population growth. There are factors that can help populations grow and others than can slow down populations from growing. Factors that limit population growth are called limiting factors. A model is simply a system of organisms, information or things presented as a mathematical description of an entity. Thus Population Models are approximations of reality described by mathematical formulae (differential equations for example) or computer programs and packages. Population Models are usually created and developed to predict the behaviour of ecological systems and biological populations. As it can be observed Population Models can be very useful and interesting, because they represent reality and some specific data and because they are capable, in many occasions, to give accurate and precise estimates that can help human mind to predict the future of a population and to compare the results gained with similar results from other models or from different populations [4]. 2. The Logistic Equation The Logistic Equation is widely used and very often seen, because it has lots of applications and can be very useful in various models. Some characteristic applications of the logistic equation is the population growth problem (model) and the harvesting in a biological population problem (model) [3]. Let us suppose that x(t ) denotes the size of a biological population at time t and x '(t ) denotes the increase in the population. The carrying capacity K of the biological environment is the maximum population that the environment can stand. If the population equals this carrying capacity then the deaths among the population become more than the births and the population can not grow any more. Let us suppose that a is the (positive) birth rate, which is not dependent of N and b is the (positive) crowding coefficient which depends on the carrying capacity of the population [2]. So it is true that : x(t ) x '(t ) a 1 x(t ) K (2.1) Leonidas A. Petrakis 2 where a b. K 2.1 Properties of the logistic equation Equation (2.1) has equilibrium points when x '(t ) 0 , that is when x ' 0 and x ' K . Thus we can say that: 0 x K gives x ' 0 and also that x K gives x ' 0 . Thus it can be observed that the point x ' 0 is unstable since any positive initial population will increase monotonically and try to reach x K . On the other hand, the point x ' K is asymptotically stable since if there is a small displacement from the point, the population will tend again towards it [1]. 2.2 The analysis and the graph of the function F ( x ) rx(1 x ) K x x r ) . It is F ( x) rx (1 ) x 2 rx, which is a parabola with K K K K respect to x . The maximum value is for x , and there are two roots x1 0 , x2 K . 2 The position of the maximum is symbolized by xMSY , while the maximum value of the function is symbolized by MSY . The graph of F ( x ) in the interval [0, K ] is depicted in Figure 1. Let F ( x) rx (1 F M MSY Fx x O xMSY K Figure 1. Graph of the function F ( x ) The roots of F ( x ) are 0 and K , therefore the functions x(t ) 0 and x (t ) K are the equilibrium solutions of the differential equation. The graph of F ( x ) with r 0.2 and K 1, 2,3,...,12 is depicted in Figure 2. Leonidas A. Petrakis 3 r 0.2, K 1:12 step 1 Fx 0.6 0.5 0.4 0.3 0.2 0.1 x 2 4 6 8 10 12 Figure 2. Graph of the function F ( x ) with r 0.2 and K 1, 2, 3, ...,12 Similarly the graph of F ( x ) with K 12 and r 0.1, 0.2, 0.3,...,1 is depicted in Figure 3. K 12, r 0:1 step 0.1 Fx 3 2.5 2 1.5 1 0.5 x 2 4 6 8 10 12 Figure 3. Graph of the function F ( x ) with K 12 and r 0.1, 0.2, 0.3, ...,1 2.3 The solution of the differential equation dx x rx(1 ) with x(0) x0 dt K dx x rx (1 ) with x(0) x0 , therefore dt K dx r x( x K ) dt K 1 1 1 r ( )dx dt K x xK K It is 1 1 ( )dx rdt x xK ln( x) ln( x K ) rt c1 Leonidas A. Petrakis 4 x e rt c1 xK ert ec1 or x(t ) K rt c e e 1 1 c1 x0 e e c1 For t 0 , we get x(0) K , thus c1 x0 K e 1 x(t ) K ert K x0 ert x0 K x0 ert then x(t ) K x0 c ert 1 therefore x (t ) K , t 0 1 ce rt Let c (2.2) The function x(t ) which is defined by equation (2.2) is the solution of the differential equation. 2.4 Analysis of the function x( t ) K It is x(t ) K 1 1 ce rt x0 e rt K x0 x0 e rt If x0 K K x0 0 x(t ) K , t 0 If x0 K K x0 0 x(t ) K , t 0 If x0 K x(t ) K , t 0 and lim x(t ) K t 1 and thus lim x(t ) K , therefore K is a stable t 1 ce rt equilibrium. On the other hand 0 is an unstable equilibrium [5]. The graph of x(t ) for various initial values is depicted in Figure 4 and Figure 5. Concluding x(t ) K x t x0 K x0 O Figure 4. Graph of the solutions x ( t ) t Leonidas A. Petrakis 5 x t K t O Figure 5. Graph of the solutions x ( t ) 3. The Generalized Logistic Model The function F ( x) rx[1 ( x b ) ] is introduced, with b 0 . K Therefore the (logistic) differential equation takes the form dx x rx[1 ( )b ] F ( x) dt K (3.1) which is named the Generalized Logistic Model. 3.1 The analysis and the graph of the function F ( x ) rx[1 ( x b ) ] K x b r r (1 b) b ) ] b x1b rx , therefore it is true that F '( x) x r. K K Kb K The root of F '( x) is x . 1 (1 b) b The position of the maximum is symbolized by xMSY , while the maximum value of the function is symbolized by MSY . The graph of F ( x ) in the interval [0, K ] is depicted in Figure 6. Let F ( x) rx[1 ( F M Fx MSY x O xMSY Figure 6. Graph of the function F ( x ) K Leonidas A. Petrakis 6 The roots of F ( x ) are 0 and K , therefore the functions x(t ) 0 and x (t ) K are the equilibrium solutions of the differential equation. 3.2 The solution of the differential equation dx x rx[1 ( )b ] with x(0) x0 dt K dx x rx[1 ( )b ] with x(0) x0 , therefore dt K dx r b x( xb K b ) dt K dx r b dt b b x( x K ) K 1 1 ( )dx rdt x xK ln( x) ln( x K ) rt c1 x e rt c1 xK ert ec1 or x(t ) K rt c e e 1 1 x0 e c1 c1 e For t 0 we get x(0) K , thus x0 K e c1 1 x0 e rt x0 K x(t ) x0 e rt 1 x0 K It is x(t ) K x(t ) K e rt x0 K x0 x0 e rt ert K x0 ert x0 K x0 ert then x(t ) K x0 c ert 1 therefore x (t ) K , t 0 (3.2) 1 ce rt The function x(t ) which is defined by equation (3.2) is the solution of the differential Let c equation. 3.3 Analysis of the function x( t ) K It is x(t ) K 1 1 ce rt x0 e rt K x0 x0 e rt If x0 K K x0 0 x(t ) K , t 0 If x0 K K x0 0 x(t ) K , t 0 Leonidas A. Petrakis 7 x0 K x(t ) K , t 0 If and lim x(t ) K t 1 and thus lim x(t ) K , therefore K is a stable t 1 ce rt equilibrium. On the other hand 0 is an unstable equilibrium. The graph of x(t ) for various initial values is depicted in Figure 7. Concluding x(t ) K The solutions of the ODE 12 x t K x t 0 10 xt 8 6 4 2 0 5 10 15 20 25 30 35 40 t Figure 7. Graph of the solutions x ( t ) of the Generalized Logistic Equation REFERENCES [1] K. Eriksson and D. Estep and P. Hansbo and C. Johnson, Computational Differential Equations, Cambridge University Press, 1966. [2] Mikls Farkas, Dynamical Models in Biology, Academic Press, 2001. [3] L. Finkelstein and E. Carson, Mathematical Modeling of Dynamical Biological Systems, Research Studies Press, 1979. [4] Frank C. Hoppenstead, Mathematical Methods of Population Biology, Cambridge University Press, 1981. [5] J. H. Hubbard and B. H. West, Differential Equations: A Dynamical Systems Approach (Part 1), Springer-Verlag, 1991. GENERAL BIBLIOGRAPHY [1] Carlos A. Braumann, Variable Effort Fishing Models in Random Environments, Mathematical Biosciences 156 (pages 1-19), 1999. [2] D. W. Jordan and P. Smith, Nonlinear Ordinary Differential Equations: An Introduction to Dynamical Systems, Oxford University Press, 1999. [3] J. D. Lambert, Numerical Methods for Ordinary Differential Systems: The Initial Value Problem, John Wiley and Sons, 1991.
