The model PHENOFIT outputs a mean probability
advertisement

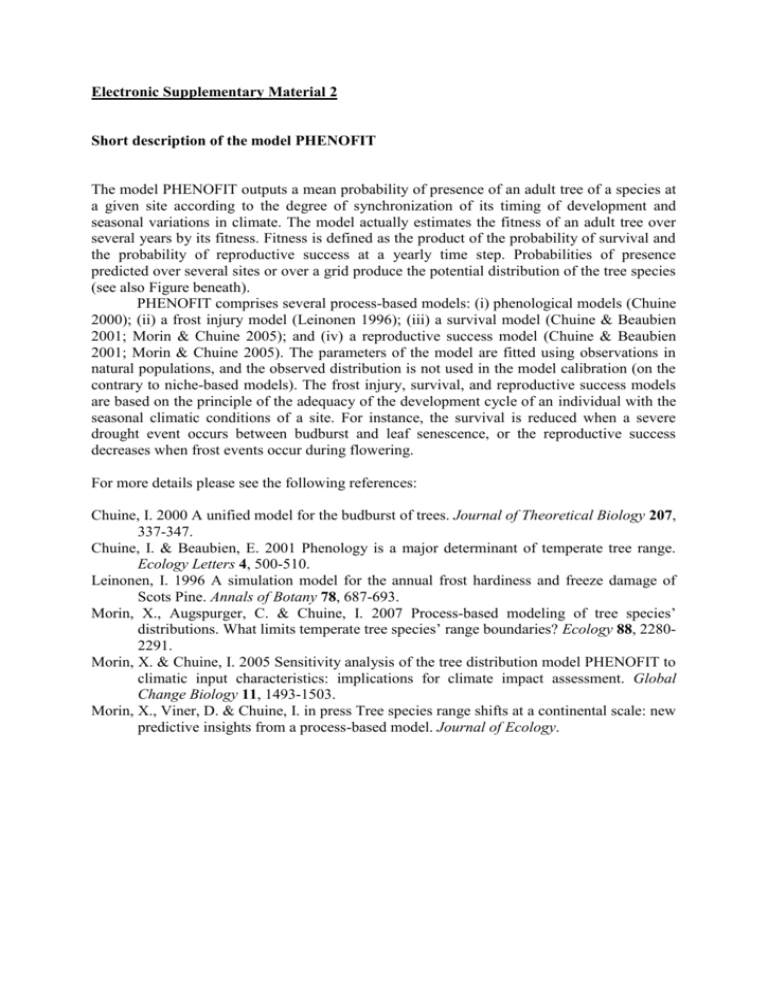
Electronic Supplementary Material 2 Short description of the model PHENOFIT The model PHENOFIT outputs a mean probability of presence of an adult tree of a species at a given site according to the degree of synchronization of its timing of development and seasonal variations in climate. The model actually estimates the fitness of an adult tree over several years by its fitness. Fitness is defined as the product of the probability of survival and the probability of reproductive success at a yearly time step. Probabilities of presence predicted over several sites or over a grid produce the potential distribution of the tree species (see also Figure beneath). PHENOFIT comprises several process-based models: (i) phenological models (Chuine 2000); (ii) a frost injury model (Leinonen 1996); (iii) a survival model (Chuine & Beaubien 2001; Morin & Chuine 2005); and (iv) a reproductive success model (Chuine & Beaubien 2001; Morin & Chuine 2005). The parameters of the model are fitted using observations in natural populations, and the observed distribution is not used in the model calibration (on the contrary to niche-based models). The frost injury, survival, and reproductive success models are based on the principle of the adequacy of the development cycle of an individual with the seasonal climatic conditions of a site. For instance, the survival is reduced when a severe drought event occurs between budburst and leaf senescence, or the reproductive success decreases when frost events occur during flowering. For more details please see the following references: Chuine, I. 2000 A unified model for the budburst of trees. Journal of Theoretical Biology 207, 337-347. Chuine, I. & Beaubien, E. 2001 Phenology is a major determinant of temperate tree range. Ecology Letters 4, 500-510. Leinonen, I. 1996 A simulation model for the annual frost hardiness and freeze damage of Scots Pine. Annals of Botany 78, 687-693. Morin, X., Augspurger, C. & Chuine, I. 2007 Process-based modeling of tree species’ distributions. What limits temperate tree species’ range boundaries? Ecology 88, 22802291. Morin, X. & Chuine, I. 2005 Sensitivity analysis of the tree distribution model PHENOFIT to climatic input characteristics: implications for climate impact assessment. Global Change Biology 11, 1493-1503. Morin, X., Viner, D. & Chuine, I. in press Tree species range shifts at a continental scale: new predictive insights from a process-based model. Journal of Ecology. Description of the model PHENOFIT. Ta: daily mean temperature; Ti: daily minimum temperature; Pm: monthly precipitations; Dl leafing date; Df flowering date; Dr ripening date; Dc leaf colouring date. Il frost injury of leaves index; Er thermal energy available since flowering ; If frost injury of flowers index; Ir fruit ripening index; Sf probability of frost survival; St probability of drought survival.


