Statistics MINITAB
advertisement
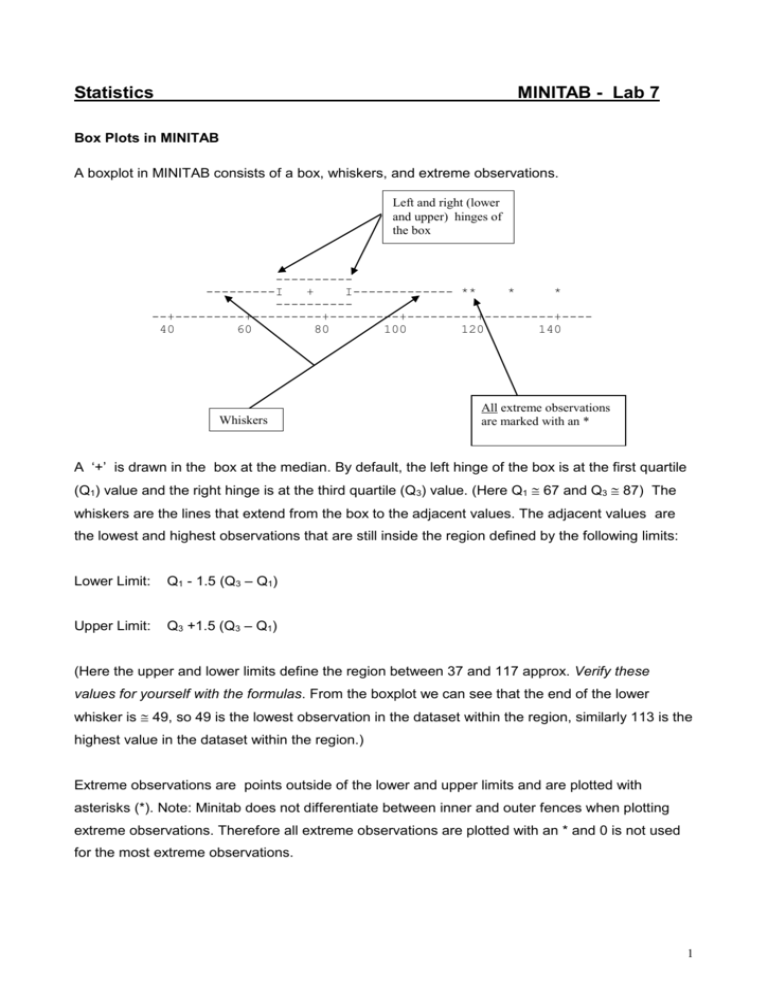
Statistics MINITAB - Lab 7 Box Plots in MINITAB A boxplot in MINITAB consists of a box, whiskers, and extreme observations. Left and right (lower and upper) hinges of the box ------------------I + I------------- ** * * -----------+---------+---------+---------+---------+---------+---40 60 80 100 120 140 Whiskers All extreme observations are marked with an * A ‘+’ is drawn in the box at the median. By default, the left hinge of the box is at the first quartile (Q1) value and the right hinge is at the third quartile (Q3) value. (Here Q1 67 and Q3 87) The whiskers are the lines that extend from the box to the adjacent values. The adjacent values are the lowest and highest observations that are still inside the region defined by the following limits: Lower Limit: Q1 - 1.5 (Q3 – Q1) Upper Limit: Q3 +1.5 (Q3 – Q1) (Here the upper and lower limits define the region between 37 and 117 approx. Verify these values for yourself with the formulas. From the boxplot we can see that the end of the lower whisker is 49, so 49 is the lowest observation in the dataset within the region, similarly 113 is the highest value in the dataset within the region.) Extreme observations are points outside of the lower and upper limits and are plotted with asterisks (*). Note: Minitab does not differentiate between inner and outer fences when plotting extreme observations. Therefore all extreme observations are plotted with an * and 0 is not used for the most extreme observations. 1 1. Open the Minitab worksheet called Downtime.MTW. This found on the online class for this course. A manufacturer of minicomputer systems is interested in improving its customer support services. As a first step, its marketing department has been charged with the responsibility of summarising the extent of customer problems in terms of system down time. The 40 most recent customers were surveyed to determine the amount of down time (in hours) they had experienced during the previous month. The data “Customer Number” and “Down Time” are in C1 and C2 of DOWNTIME.MTW, respectively. 2. Use Minitab Graph > Character Graphs > Boxplot to construct a boxplot for this data. Using the boxplot get approximate values for the following: What is the median down time __________________ What is the interquartile range ___________________ What type of skew (left/right) if any is apparent from the boxplot _______________ 3. Using Minitab calculate the mean, standard deviation and median of the of downtime: Mean = ________ Standard Deviation = __________ Median = ____________ If we assume that downtime is approximately normally distributed what is the probability of having a downtime greater that 47 ? _____________________ 4. Use your boxplot to determine which customers are having extreme down times. Let us imagine that a decision has been made that any extreme downtimes are genuine outliers (i.e. are values that for some reason do not truly represent the distribution of downtimes.) Set the downtimes for these customers to missing values by replacing their downtimes with an *. Now redraw the boxplot and note any changes from last time. _______________________________________________________________________ _______________________________________________________________________ 5. Calculate the mean standard deviation and median of the amended data (with the outliers set to missing). 2 Mean = ________ Standard Deviation = __________ Median = ____________ Why is the mean lower now ? _______________________________________________ Why is the standard deviation lower now ? ______________________________________ Why is the median lower now ? _______________________________________________ Do you think the assumption of normality is more reasonable now ? Why ? _______________________________________________________________________ What is the probability of having a downtime greater than 47 now ? Why has this probability changed from last time ? _______________________________________________________________________ _______________________________________________________________________ Using the empirical rule what is the range (in hours of downtime) within which you would expect to find 68% of your data ? range from ______________ to _______________. What percentage of values in the amended data set are outside this range ? _________ ASSIGNMENT: Part 1: Open the dataset Variables.MTW again. Generate a boxplot of both VARS1 and VARS2 on the same axes by: Graph => Boxplot Click on VARS1 under Y for Graph 1 and VARS2 under Y for Graph 2. Click on Frame => Multiple Graphs => Overlay graphs on the same page If your boxplots have colour in the centre box it can be difficult to interpret them. Generate the graphs again and change this under ‘Edit Attributes’. 3 Compare the two boxplots and comment on the differences: _______________________________________________________________________ _______________________________________________________________________ ______________________________________________________________________ Part 2: Using the empirical rule calculate the following intervals (in hours of downtime) for the data with the extreme observations set to missing. Interval containing approx. % of data by empirical rule 95% from ___________ to _______________ 99.7% from ___________ to _______________ What is the lowest standardised score (Z score) it is possible to have with this data set ? _____________ Can you see any theoretical problem with applying the empirical rule to this set of data ? _______________________________________________________________________ _______________________________________________________________________ REVISION SUMMARY After this lab you should be able to : - Know how to generate Boxplots in Minitab - Understand how to generate a boxplot yourself by hand - Understand how to interpret a boxplot, ie get the mean, median, interquartile range and identify any skew, outliers - Know how to spot if assuming a normal distribution is reasonable - Generate summary statistics (done before) - Calculate a probability assuming a normal distribution (done before) - Generate two boxplots on the same page END 4 5
