Algebra I - Fort Thomas Independent Schools
advertisement
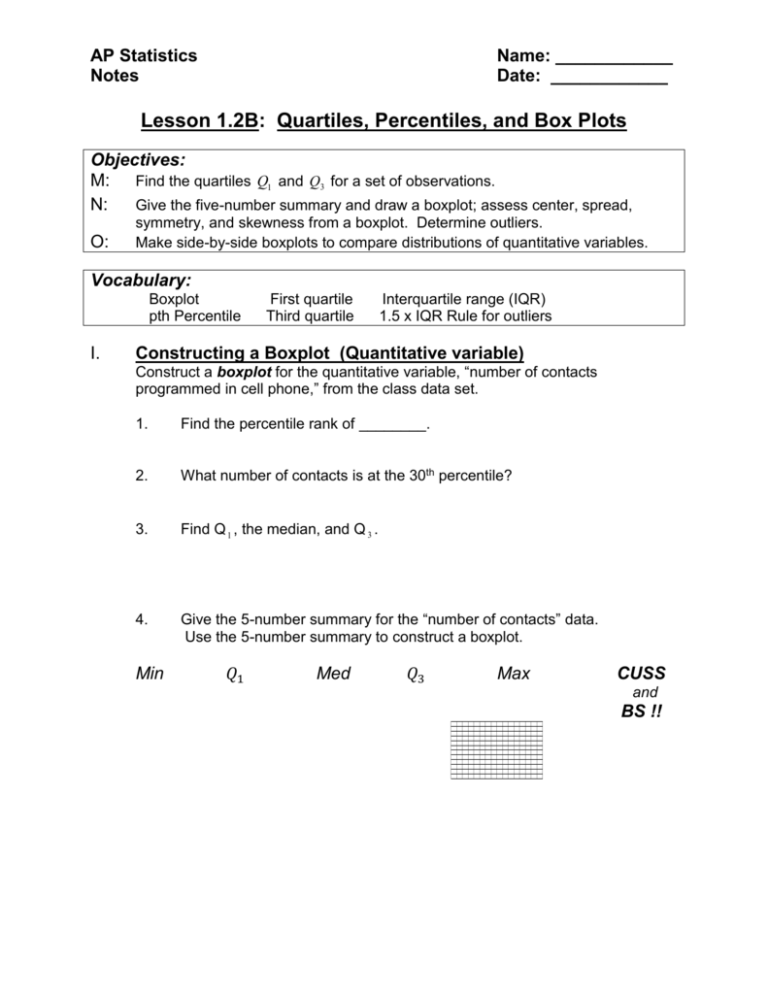
AP Statistics Notes Name: ____________ Date: ____________ Lesson 1.2B: Quartiles, Percentiles, and Box Plots Objectives: M: Find the quartiles Q1 and Q3 for a set of observations. N: Give the five-number summary and draw a boxplot; assess center, spread, O: symmetry, and skewness from a boxplot. Determine outliers. Make side-by-side boxplots to compare distributions of quantitative variables. Vocabulary: Boxplot pth Percentile I. First quartile Third quartile Interquartile range (IQR) 1.5 x IQR Rule for outliers Constructing a Boxplot (Quantitative variable) Construct a boxplot for the quantitative variable, “number of contacts programmed in cell phone,” from the class data set. 1. Find the percentile rank of ________. 2. What number of contacts is at the 30th percentile? 3. Find Q 1 , the median, and Q 3 . 4. Give the 5-number summary for the “number of contacts” data. Use the 5-number summary to construct a boxplot. Min 𝑄1 Med 𝑄3 Max CUSS and BS !! 5. Use the 1.5 x IQR criteria to determine if there are any outliers in the “contacts” data. 6. If you identified any outliers in #5, construct a modified boxplot for the “contact” data. (Construct it above the original boxplot on the grid on the preceding page.) II. Comparing Boxplots 1. Determine the 5-number summary for the female “contacts” data. Determine the 5-number summary for the male “contacts” data. 2. Use the 1.5 x IQR to determine if there are any outliers in the female or male “contacts” data. 3. Construct parallel boxplots (maybe modified) for the female and male “contacts” data. Remember to use the same scale on your graphs so the boxplots are easier to compare. 4. Compare the female and male “contacts” boxplots. CUSS and BS !!
