original version, in MS Word
advertisement
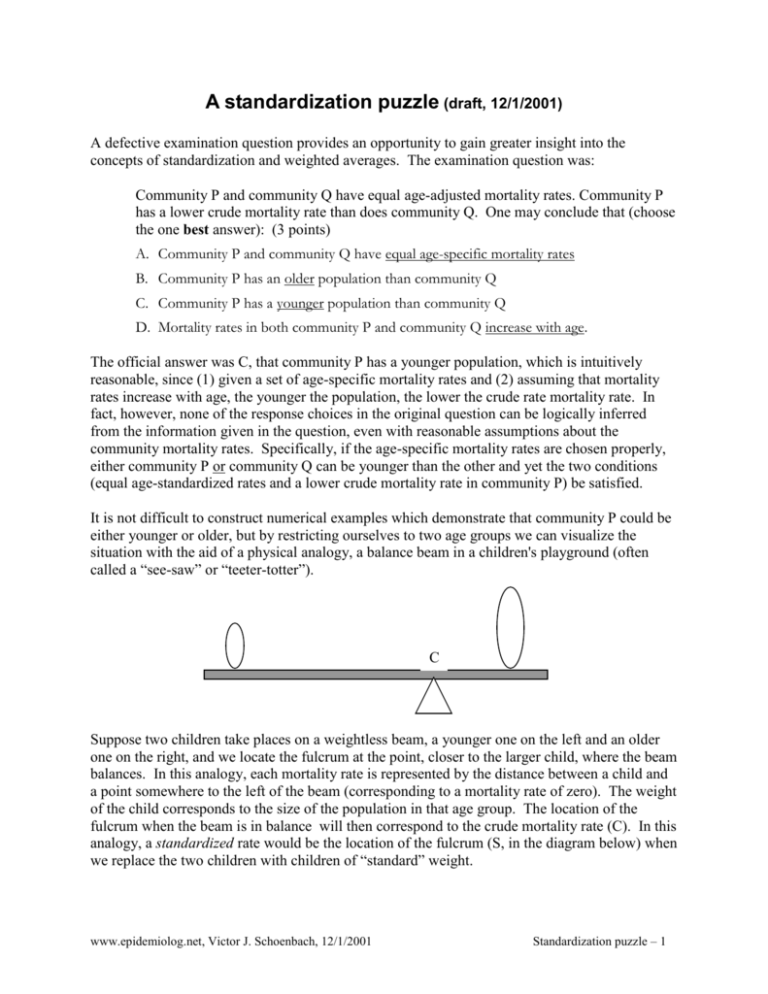
A standardization puzzle (draft, 12/1/2001) A defective examination question provides an opportunity to gain greater insight into the concepts of standardization and weighted averages. The examination question was: Community P and community Q have equal age-adjusted mortality rates. Community P has a lower crude mortality rate than does community Q. One may conclude that (choose the one best answer): (3 points) A. Community P and community Q have equal age-specific mortality rates B. Community P has an older population than community Q C. Community P has a younger population than community Q D. Mortality rates in both community P and community Q increase with age. The official answer was C, that community P has a younger population, which is intuitively reasonable, since (1) given a set of age-specific mortality rates and (2) assuming that mortality rates increase with age, the younger the population, the lower the crude rate mortality rate. In fact, however, none of the response choices in the original question can be logically inferred from the information given in the question, even with reasonable assumptions about the community mortality rates. Specifically, if the age-specific mortality rates are chosen properly, either community P or community Q can be younger than the other and yet the two conditions (equal age-standardized rates and a lower crude mortality rate in community P) be satisfied. It is not difficult to construct numerical examples which demonstrate that community P could be either younger or older, but by restricting ourselves to two age groups we can visualize the situation with the aid of a physical analogy, a balance beam in a children's playground (often called a “see-saw” or “teeter-totter”). C Suppose two children take places on a weightless beam, a younger one on the left and an older one on the right, and we locate the fulcrum at the point, closer to the larger child, where the beam balances. In this analogy, each mortality rate is represented by the distance between a child and a point somewhere to the left of the beam (corresponding to a mortality rate of zero). The weight of the child corresponds to the size of the population in that age group. The location of the fulcrum when the beam is in balance will then correspond to the crude mortality rate (C). In this analogy, a standardized rate would be the location of the fulcrum (S, in the diagram below) when we replace the two children with children of “standard” weight. www.epidemiolog.net, Victor J. Schoenbach, 12/1/2001 Standardization puzzle – 1 S A balance beam must have the fulcrum between the two children, of course, just as a weighted average must lie between the lowest and highest numbers. Both the crude and the standardized rates are weighted averages of the age-specific rates, so we know that both must lie between the lowest and highest age-specific rates. We also know that a weighted average can fall anywhere between the lowest and highest specific rate, depending upon the relative weights used in computing the average. The examination question states that the crude rate (PC) for community P is less than the crude rate (QC) for community Q. For the balance beams, that means that the fulcrum for the “P” children is to the left of the fulcrum for the “Q” children. If we start with a situation in which the two crude rates are the same (i.e., the fulcrums for each beam line up), there are two ways that we can move the fulcrum between the P children to the left: (1) by increasing the weight of the younger child relative to the older child or by lengthening the (weightless) beam and moving the child farther to the left. Increasing the weight of the younger child corresponds to increasing the size of the younger age group in community P, making its population distribution younger. So in the original question, response choice C does offer one way in which the conditions of the problem can be met. However, even if the age distribution of community P is older than that in community Q, the crude rate (fulcrum) for community P can be moved to the left by making the mortality rate in the younger group sufficiently smaller than that for the younger group in community Q. Q2 Q1 QC P2 P1 PC www.epidemiolog.net, Victor J. Schoenbach, 12/1/2001 Standardization puzzle – 2 The only other information from the question is that the two populations have the same standardized mortality rate. This condition means that in our playground, when we replace the children with children of “standard” weight (the two younger children weigh the same as each other and the two older children weigh the same as each other), the beams will balance with the fulcrums located in the same position relative to the positions of the children on each beam. It turns out that we can find “standard” weights to make this happen only when the two Q children are between the two P children or the two P children are between the two Q children (i.e., either Q1<P1<P2<Q2 or P1<Q1<Q2<P2). A moment’s reflection indicates why this must be so. Age standardization is designed to make two sets of rates comparable by using the same weights to take an average of each set. So if the rates in one set are all lower than the rates in another, then the standardized rates should surely be in the same relation to each other. It may not be so obvious that if one pair of children are between the members of another pair, then it is always possible to find weights that will enable the two pairs of children to balance at the same location. Therefore the fact that the standardized rates are equal does not tell us anything beyond the fact that one pair of rates lies between the other pair. For those who like algebra, we can easily demonstrate that the equality of the standardized rates is equivalent to saying that either Q1<P1<P2<Q2 or P1<Q1<Q2<P2. Define notation as follows: Younger age group Older age group Total (crude) Standardized Community P Community Q Proportion of Proportion of population Mortality rate population Mortality rate 1 – Wp P1 1 – Wq Q1 Wp P2 Wq Q2 (1 – Wp) P1 + Wp P2 (1 – Wq) Q1 + Wq Q2 (1 – Ws) P1 + Ws P2 (1 – Ws) Q1 + Ws Q2 We use P and Q to represent mortality rates, with the subscript 1 referring to the younger group in each community and 2 referring to the older group. We assume that within each community, mortality rates are greater in the older group (i.e., P1<P2 and Q1<Q2). Wp and Wq refer to the proportion of each community's population that the older group comprises. The total, or crude, mortality rates are written as averages of the age-specific rates, weighted by the corresponding proportions of the total population in the age group. The standardized rates are also shown as weighted averages, but here the weights from a standard population (hence, Ws) are used. According to the question, the standardized rates for the two communities are equal, i.e.,: (1 – Ws) P1 + Ws P2 = (1 – Ws) Q1 + Ws Q2 By re-arranging terms, we can write this expression as: (1 – Ws) P1 – (1 – Ws) Q1 = Ws Q2 – Ws P2 and then factor out the common variables: www.epidemiolog.net, Victor J. Schoenbach, 12/1/2001 Standardization puzzle – 3 (1 – Ws) (P1 – Q1) = Ws (Q2 – P2) From this expression we can deduce that either the age-specific mortality rates in the two populations are identical (i.e., P1=Q1 and P2=Q2) or the age-specific mortality rates in one community lie within those for the other (i.e., either Q1<P1<P2<Q2 or P1<Q1<Q2<P2). The reason one of these must be true is that for the two sides of the equation to be equal, they must both have the same sign, i.e., both left and right sides must be positive or both must be negative. Since Ws is a proportion and must lie between 0 and 1, both Ws and (1 – Ws) are positive, so the value of Ws will not affect the signs. For both sides to be positive, Q1<P1<P2<Q2; for both sides to be negative, P1<Q1<Q2<P2. Pictorially, the situation must be something like: Q1———P1———P2————————————————Q2 or: P1—————————Q1—————————————————————Q2——P2 The standardized mortality rates, which the exam question says are the same for the two communities, must lie between the inner pair of rates (because of the restrictions for a weighted average). If we are told the four specific rates, we can calcuate the location of the standardized rates, since once the rates have been specified, the above equation can be solved for Ws, e.g.: (1 – Ws) P1 + Ws P2 = (1 – Ws) Q1 + Ws Q2 P1 – Ws P1 + Ws P2 = Q1 – Ws Q1 + Ws Q2 Ws Q1 – Ws P1 + Ws P2 – Ws Q2 = Q1 – P1 Ws (Q1 – P1 + P2 –Q2) = Q1 – P1 Ws Q1 – P1 = ––––––––––––––––– (Q1 – P1 + P2 – Q2) From this we can see that given four mortality rates, arranged in the order P1<Q1<Q2<P2, the standardized rates for the two communities (S in the figure below) will be equal if and only if a standard population is chosen with Ws satisfying this equation (recall that Ws is the proportion of the total population size accounted for by the older age group). Acknowledgement: Yuthana Tanwongwan deserves the credit for realizing that the question was defective. www.epidemiolog.net, Victor J. Schoenbach, 12/1/2001 Standardization puzzle – 4


