Depth Estimation and Focus Recovery
advertisement
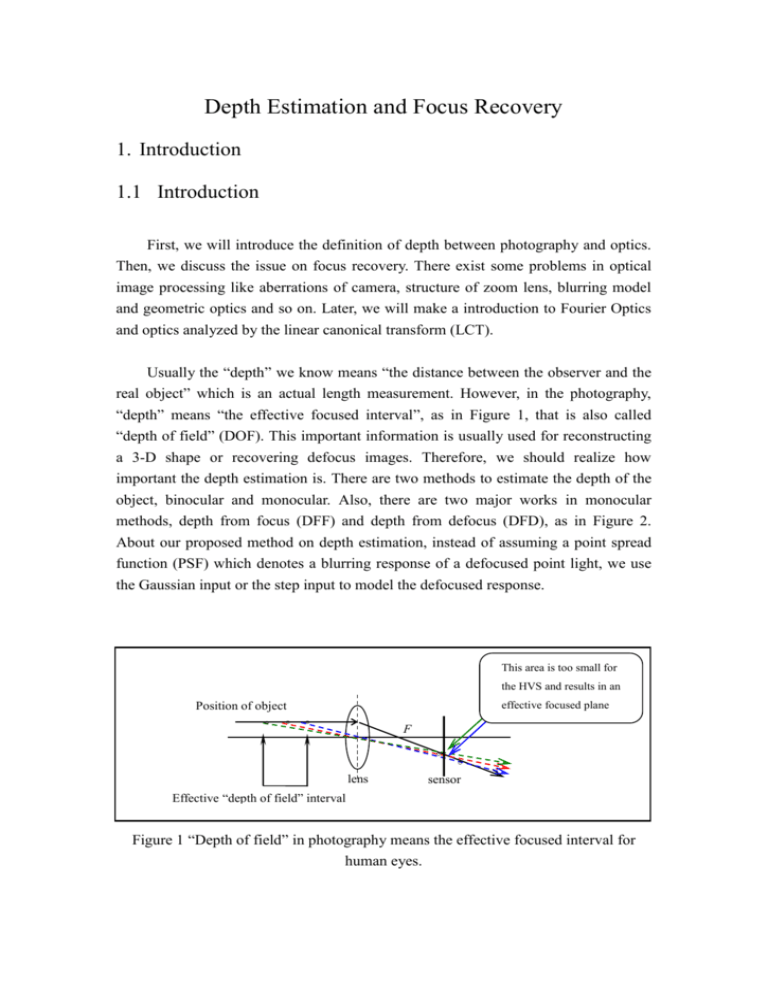
Depth Estimation and Focus Recovery 1. Introduction 1.1 Introduction First, we will introduce the definition of depth between photography and optics. Then, we discuss the issue on focus recovery. There exist some problems in optical image processing like aberrations of camera, structure of zoom lens, blurring model and geometric optics and so on. Later, we will make a introduction to Fourier Optics and optics analyzed by the linear canonical transform (LCT). Usually the “depth” we know means “the distance between the observer and the real object” which is an actual length measurement. However, in the photography, “depth” means “the effective focused interval”, as in Figure 1, that is also called “depth of field” (DOF). This important information is usually used for reconstructing a 3-D shape or recovering defocus images. Therefore, we should realize how important the depth estimation is. There are two methods to estimate the depth of the object, binocular and monocular. Also, there are two major works in monocular methods, depth from focus (DFF) and depth from defocus (DFD), as in Figure 2. About our proposed method on depth estimation, instead of assuming a point spread function (PSF) which denotes a blurring response of a defocused point light, we use the Gaussian input or the step input to model the defocused response. This area is too small for the HVS and results in an effective focused plane Position of object 。 。。 。 。。 。 。。 F lens Effective “depth of field” interval 。 。 。 sensor 。 。 。 Figure 1 “Depth of field” in photography means the effective focused interval for human eyes. Binocular Stereo focus Depth from defocus (DFD) Monocular Depth from focus (DFF) Figure 2 Categories of depth estimation. Focus recovery is a important subject in optical image processing. We can recover focus from defocused images only after we solve the depth values from them. Our proposed method on recovering focus images is to inverse and simulates the original photographic environment based on LCT (Linear Canonical Transform). Before we enter the topics of LCT, we will introduce some problems happened to camera. These problems are aberrations, structure of zoom lens and blurring model and the geometric optics. 2. Pleliminary Works 2.1 The Common Phenomenon in Optical Systems There are main problems of aberrations which existing on the common optical lenses. The spherical aberration and the chromatic aberration are two main subjects. Aspherical convex lens is a solution to the spherical aberration and a combination of convex lens and the concave lens is a solution to the chromatic aberration, After considering about the aberrations of the lenses, we consequently introduce the structure of a zoom lens. All zoom lenses have the joint property is that projects the image on a fixed image plane with a variant focal lengths. When the user changes the focal length of camera shot to enlarge or reduce the image view, there should be no re-focused action. To satisfy this action, we need a camera shot that has the basic lens structure as the three groups as Figure 3. The function for the first group is to be adjusted for different distances of subjects. The function for the second group is to change the focal length with a quantity. The function for the last group is to make sure the incident light to be parallel and this gets the effects like the telescope. sensor 1st. part 1st. part 2ed. part 2ed. part 3rd. part 3rd. part The real Variogon (design for vario- lens) zoom lens, 2.8/10-40 mm. Figure 3 Three functional groups for a zoom lens. 2.2 Blurring Model and The Geometric Optics Images are typically modeled as the result of a linear operator with a kernel depending on the optical structure of the camera. An “ideal” unblurred image r x, y convolve with a operator h x, y , and get the result which is also called the radiance image in many documents: I ( x, y ) h u, v r x u , y v dudv R u , v R (2.1) where h x, y is called the point spread function (PSF), which is the response of the camera of a point light source. R is the blurring radius of the point light source decided by the camera parameters. The imaging point may be before the sensor to form a positive value R, and there may be a negative value R as it is behind the sensor as shown in Figure 4 and Figure 5. We can find an impotant formula for this thesis: 1 1 1 u v F (2.2) 2R D sv v (2.3) Ds 1 1 1 2 F s u FsD u sD (2 R D) F (2.4) R where D is the diameter of the lens aperture, F is the focal length of the lens, s denotes the distance between the lens and the CCD (Charge Couple Device, the imaging sensor) and u is the depth of the object. In this article, we use the Gaussian distribution function as PDF. h x, y x2 y 2 exp 2 2 2 2 1 (2.5) where kR is the diffusion parameter based on the radius of diffusion and the constant k k 0 depends on characteristics of the cameras. Because we have to consider the aberrations, we replace Gaussian function with constant function. That is, we always have to determine where the region of the scene is before or behind the focus plane. F F D/2 s u 2R : R>0 Biconvex v sensor Figure 4 Geometric optics on blurring imaging before the screen (sensor). sensor F F D/2 s u 2R : R<0 Biconvex v Figure 5 Geometric optics on blurring imaging behind the screen (sensor). 2.3 Introduction to Fourier Optics In 1665, Grimaldi is the first one who declared that once the point light source pass through an aperture and it will not only cause geometrical progressing but also the corpuscular light spreading. We call the phenomenon diffraction of light on aperture. Because the image produced by camera includes not only lenses but also aperture. In 1882, Gustav Kirchhoff proposed two important assumptions in aperture effect: 1 Across the specific surface , the field distribution U and its derivative U according the obstacle’s unit vector n are exactly the same. Just like there is n no existence of the obstacle, as Figure 6. 2 The values of U and U are identically zero. n P0 r01 P1 n obstacle Figure 6 One aperture in an obstacle. P1 is the point on the aperture surface and P0 is the point away from the aperture. One important principle - Huygens-Fresnel Principle, is an approximation to represent the near-field advancing wave disturbance that include the Kirchhoff’s boundary condition, as in (2.6). U P0 1 4 e jkr01 U P1 r01 n jkU P1 cos ds where k denotes the wave number that is equal to dimensions. If r01 2 (2.6) and s denotes the spatial : U P0 ,and replace cos by 1 e jkr01 U P cos ds 1 j r01 (2.7) 1/2 z 2 2 and then replace r01 by x0 x1 y0 y1 z2 , r01 and note that we have the finite integral value for Kirchhoff’s boundary conditions: z e jkr01 U x0 , y0 U x1, y1 r012 dx1dy1 j 1/2 x x 2 y y 2 exp jk z1 0 1 0 1 (2.8) z z 1 U x1 , y1 dx1dy1 2 2 j z x x y y 1 0 1 0 1 z z Now consider that if we have z x x is, 0 1 z 2 y y 1 and 0 1 z and P0 is near from the original point, that 2 1. Then, we can derive the equation as in (2.9): 1/2 x x 2 y y 2 U x0 , y0 U x1, y1 exp jk z1 0 z 1 0 z 1 dx1dy1 j z 1 (2.9) h x0 , y0 , x1, y1 U x1, y1 dx1dy1 Then we can consider one condition. That is, the direction between P1 x1, y1 an P0 x0 , y0 is close to the direction of z. Therefore, we can get a approximation as in (2.10): 1/2 x x 2 y y 2 1 0 1 0 1 z z U x0 , y0 2 1 x x 1 y y 1 0 1 0 1 2 z 2 z 2 jk z k e 2 2 U x1 , y1 exp j x0 x1 y0 y1 dx1dy1 j z 2z Hence, we can view equation (2.10) as a convolution form and its transfer function connecting to the Fresnel-approximation as in (2.11): (2.10) U x0 , y0 h x0 , y0 U x1 , y1 e jk z j 2 z x0 h x0 , y0 e j z k H fx , f y 2 y02 (2.11) e 2 z F h x0 , y0 j e j z k jk z If there is a condition as k x12 y12 2z j 2 f x2 f y2 max k /2 z e jk z e j z f x 2 f y 2 1 , we have a far-field diffraction form as in (2.12) and (2.13). k e jk z 2 2 U x0 , y0 U x1 , y1 exp j x0 x1 y0 y1 dx1dy1 j z 2z e jk z j 2 z x0 e j z k 2 y02 2 j x0 x1 y0 y1 k 2 2 z U x , y exp j x y e dx1dy1 1 1 2z 1 1 (2.12) U x0 , y0 where f x e jk z e e jk z e j k x02 y02 2z j z j k x02 y02 2z j z k F U x1 , y1 exp j x12 y12 2z (2.13) F U x1 , y1 x0 y , fy 0 . z z About this chapter, we derive a series of steps and use complex calculate method to get the image intensity from the aperture. If the image is a huge object, we have to calculate the value of every point of light source through the aperture. Therefore, we have to use the LCT method to approximate the result. We may get a distortion image, but the distortion is in our acceptable range. Next chapter, we will introduce you how to use LCT to estimate depth and recover the focus in detail. 3. Optics Analyzed by the Linear Canonical Transform (LCT) 3.1 Introduction to LCT LCT is good tool for analyzing and is a scalable transform connecting to lots of important kernels as Fresnel transform and fractional Fourier transform and so on. In words, LCT (defined as (3.1) (3.2) (3.3) (3.4)) is a representation of matrix which contains 4 parameters is formed from 3 freedoms as in (3.5). Commutative character does not hold in Matrix properties and so as the LCT kernel. Because the matrix has 3 degrees of freedom, that is AD-BC=1. There may be two condition if B is equal to zero or not. (as shown in (3.6)) LM f u LM u , u ' f u ' du ' where LM u , u ' exp j / 4 exp j u 2 2 uu ' u '2 (3.1) M , , is a set where f(u) is the density function of image, and LM is the operator of LCT. f ' u LM 2 u, u '' LM1 u '', u ' f u ' du ' du '' LM 2 u, u '' LM1 u '', u ' du '' f u ' du ' (3.2) M1 1 , 1 , 1 M 2 2 , 2 , 2 h u, u ' LM 2 u, u '' LM1 u '', u ' du '' sgn 1 2 / 3 3 exp j / 4 exp j 3u 2 23uu ' 3u '2 22 3 2 1 2 3 1 2 1 2 (3.3) (3.4) 12 3 1 1 2 1/ A B / M C D / / M 3 M 2 M1 (3.5) D 2 1 A 2 LM u, u ' 1/ B exp j / 4 exp j u 2 uu ' u ' for B 0 B B B (3.6) L f u D exp j CDu 2 f D u for B =0 M 2 3.2 Simulation on Images by LCTs LCT is not the only one transform to simulate images but is more convenient to control those four parameters in matrix. It is complicated to simulate images by Fresnel transform hence the LCT is utilized to solve this approximation problem. However, the simulation on the LCT is a hard work. We use the LCT kernel which is defined as in (3.7). D 2 1 A 2 LM u, u ' 1/ B exp j / 4 exp j u 2 uu ' u ' for B 0 B B B (3.7) L f u D exp j CDu 2 f D u for B =0 M 2 Here, we show an example of optical system simulated by LCT. From Figure 7, it is a simplest case of optical system. Where z is the distance between object (Uo) and lens, s is the distance between lens and sensor (Ui), f is focal length of the lens and is wavelength of the light. s z Uo Ul Ul’ Ui Figure 7 A common single thin lens system with distance between object and lens z and distance between lens and sensor s . We can easily construct the above optical system by a series of LCT parameters, a general result shown in (3.8). s zs 1 z s 0 f f 1 z (3.8) 1 0 1 1 z 1 f f Here, the four parameters of LCT is decided by matrix computation as shown in (3.8). 1 s zs z Where A is 1 , B is z and D is 1 . s , C is f f f f 1 A B 1 s C D 0 1 1 f We then discuss a special case that is as in Figure 8, where z = s= f . That is, a symmetric system locating at focal length of both sides. f f f : focal length Uo Ul Ul’ Ui Figure 8 Special case of an optical system – Fourier transform approximation. We can decide the four parameters of LCT from matrix computation and get the result as in (3.10) and (3.11). The result in (3.11) shows a scaled Fourier transform by this special case. That means we can construct an optical system to represent a field intensity which denotes the Fourier transform of its source intensity. Actually, we can construct almost optical phenomena through LCTs. LM f u LM u, u ' f u ' du ' LM u, u ' : function representation (kernel) 1 A B 1 f C D 0 1 1 f 0 1 f 1 0 1 (3.9) (3.10) 0 A B 1 C D f f f 0 0 0 0 1 1 1 0 f (3.11) Fourier transform scaling Form (3.11), we can realize LCT can present any scaling function based on the equation (3.7). Table 1 show the relationship between some common function representation with LCT transforming parameters. Function Characteristics representation Chirp multiplication exp j qu 2 u u ' Transforming parameters exp j / 4 1/ r Chirp convolution exp j u u ' / r Fractional Fourier 1 i cot icot 2 /2 e 2 transform e 2 icsc t icot t 2 /2 exp j / 4 Fourier transform Scaling exp j 2 uu ' S u Su ' 1 0 q 1 1 r 0 1 cos / 2 sin / 2 sin / 2 cos / 2 0 1 1 0 0 S 0 1/ S Table 1 Optical analyzed functions approximated by the LCT 2uu ' In (3.7), we found some problem at the term exp j when B is not B zero. We consider this term as a kernel of the fast Fourier transform (FFT), mn exp j , because the two terms are similar. Where m is the output axis, n is the N input axis and N denotes the FFT point number. However, we will encounter some problems by using the kernel .Here we list two problems when we simulate optical systems by LCT with the kernel of In (3.8), B z zs f this specific term: s . B is always a tiny number in the real imaging environment. However, the role of B is as the same as N in the FFT. In the FFT, the point number N must be an integer, hence the value of B is limited. This is because that depth value z, focal length f and imaging distance s can not be free decided. Because of the small value of B, we must have higher resolution u and u ' as in (3.9) and we will have large computation. In order to solve these problems, we have to discuss the definition of the LCT and we find the the main problem is due to the small value of B. One of the solution is matrix decomposition as in (3.12). A B B A 0 1 C D D C 1 0 (3.12) 0 1 From (3.12), we know that is LCT parameters representation of 1 0 Fourier transform, so we can do the FFT on the input signal first then do the LCT with parameters as in (3.13) B A D C (3.13) In (3.13), we now have the value of -A to dominate the resolution problem of the LCT and the value of –A in is s s 1 . Obviously, the value of 1 is much bigger than f f z zs f s . In this way, the resolution of u and u ' is also not necessarily huge. 3.3 Implementation of all kinds of Optical system With the introduction of section 3.1, we have some basic concept of the relationship between LCT matrix and simple optical system. However, it is not enough for us to simulate all kinds of optical system. We found that three lenses optical system can generalize almost case which might happen in optical system, and let us consider the following instrument as shown in Figure 9: f1 f2 s1 z f3 s2 sensor s1 Figure 9 The instrument with three lenses. According by equation (3.8), we can know the four parameters of the LCT of this optical system are as in (3.14): 1 A B C D 1 f 3 0 A B 1 1 2 (3.14) A B , the term is composed of several matrixes as in (3.15): 1 2 1 A B 1 s2 0 1 1 f 1 2 2 0 1 1 s1 1 1 0 1 f1 , from (3.14), we can derive the equation (3.16): 0 1 s (3.15) 1 0 1 f3 A B C 1 D 2 (3.16) According to section 3.1, we know AD-BC=1, hence, we have three free degrees in the four parameters of LCT. From (3.16), we can transfer one free degree of the LCT parameters to the focal length f3, but we still have two free degrees which have to be solved. Therefore, we must derive the relationship between f1, f2, A and B. The derivation is shown below: 1 A As B 1 s2 s 0 1 1 f 1 1 2 2 1 A As B s 1 1 1 2 f1 B As A f f 1 1 2 1s 1 f f 1 1 0 1 1 s1 1 1 0 1 f1 0 1 (3.17) 0 1 1 s1 1 s2 1 1 0 1 0 1 f 2 0 1 (3.18) Asu1 Bu1 u B As 1 2 f1 f1 f2 su u 1 1u1 1 1 2 1 2 1s f1 f1 f2 Au1 u2 1 (3.19) We only focus on the indices of containing A or B. Hence, A u B As 1 2 f1 f1 f2 Au1 Asu1 f1 Bu 1 B As u2 f1 (3.20) , and f1 is found as in (3.21) f1 Asu1 Bu1 u2 Asu1 Au1 B (3.21) , and with the same derivation, we can find f2 as in (3.22): f2 f1u2 f1 As f1 A B (3.22) By equation (3.16), (3.21) and (3.22), we prove an optical system like the illustration as in Figure 8 can be fully satisfy the LCT parameters. That is, we can only use three lenses to simulate all possible optical systems. Then, the simulations of LCT parameters can be generalized through this analyzed method. 3.4 Proposed DFD Method with LCT Blurring Models on The Gaussian Function We continue to discuss the Linear Canonical transform (LCT) in this chapter. First, we consider a point spread function as the following form: h x, y x2 y 2 exp 2 2 2 2 1 (3.23) Actually an ideal PSF should be a uniform distribution as in the geometric optics, that is, no blurring would happen in the images. However, the Gaussian form is considered of the free space distortions in the Fourier optics. Because the LCT can describe all of the wave propagations, we combine the derivation on the scalable LCT with the PSF. According to its four free parameters, we can model any situations of the PSFs by the LCTs. That is, we can get a solution similar to a Gaussian form but is with four adjustable parameters. Hence, we could use final solution with inverse parameters to recover the input source. Here we will show the steps to solve the amplitude of the LCT of g(t) as in (3.24) to (3.27): LM g t D j u 1 /4 e e B B D 1 B 2 1 A 2 uu ' u '2 B B 1 g u ' du ' A 2 j u ' 1 /4 j B u 2 1 B e e e 2 B | | D j u 2 e /4 e B 2 1 j 2 u u ' B (3.24) du ' (3.25) A 2 2 1 2 j 2 4 2u 2 2 1 4 A B exp j 2 2 2 4 2 2 | | B A B 4 A 1 4 4 2 2 B (3.26) 1 1 4 B | | 2 A 2 4 2 4 2 2 2u 2 B exp 2 2 B 4 2 4 A2 4 2 A 1 4 2 B 2 2 (3.27) We have introduced DFD briefly in previous chapter. Here, we will continue to discuss how to use DFD method to find depth. The main work for DFD methods is to compare two images with different defocus degrees. By using the relation between the bluing variation and the blurring radius R to discover the depth cues. We want to apply Guassian blurring model with LCTs. Note that the key point concentrates on the comparing with two images with variations i . Assume there are two point light sources g x1, y1 , g x2 , y2 with different defocus degrees as in (3.28). 12 r12 22 r22 2 2 4 2 2 4 g x1 , y1 e B A 1 B A 2 g x2 , y2 (3.28) where r1 x12 y12 , r2 x22 y22 we take the natural logarithm, 2 B A 2 2 4 r22 1 log g x1 , y1 g x2 , y2 r12 (3.29) According to the optical system as in (3.8), we replace the parameters A and B : A2 2 2 2 Az s 2 (3.30) where r22 1 log g x1 , y1 g x2 , y2 r12 (3.31) While getting two different values for s and i , we have the compared relations as in (3.32) and (3.33). A2 2 2 2 A z s 2 1 1 1 1 (3.32) A2 2 2 2 A z s 2 2 2 2 2 (3.33) Note that inside the camera structure, the sensor plane is put with a distance that is equal to focal lengths. Due to this reason we generally choose si f . Through comparing, the depth can be solved by this LCT model: z 1 A2 A2 2 s 2 2 2 (3.34) Hence, through a series of derivation, we can get the value of depth and more over we can do focus recovery. 4 Fiber-optic Communication 4.1 Introduction to fiber-optic communication Fiber-optic communication is a method of transmitting information from one place to another by sending pulses of light through an optical fiber. The light can carry information after modulated. From the 1970s, fiber-optic communication systems have revolutionized the telecommunications industry and have played an important role in the digital of the Information Age. With the advantages of large capacity and good encryption, optical fibers have become the most common method of cable communication. We put the message which produced by sender into transmitter, modulate the message by appropriate carrier, transmit the modulated signal into receiver, and demodulate the signal to original message. The process of communicating using fiber-optics involves the following basic steps: 1. Creating the optical signal involving the use a transmitter 2. Relaying the signal along the fiber, ensuring that the signal does not become too distorted or weak 3. Receiving the optical signal, and converting it into an electrical signal. 4.2 Applications of fiber-optic communication Optical fiber is used to transmit telephone signals, Internet communication, and cable television signals by many telecommunications companies. Sometimes, one fiber can carry all signals mentioned above. Because of much lower attenuation and interference, optical fiber has large advantages over traditional copper wire in long-distance and high-demand applications. However, infrastructure development in cities was relatively difficult and time-consuming, and fiber-optic systems were complex and expensive to install and carry out. Due to these difficulties, in the early time fiber-optic communication systems had been installed in long-distance applications, where they can be taken good advantage of their full transmission capacity and can offset the increased cost. Since the year 2000, the prices for fiber-optic communications have dropped dramatically. Today, the scale of fiber-based network is equal to copper-based network. Since 1990, when optical-amplification systems became commercially available, many long-distance fiber-optics communications come true. By 2002, an intercontinental network of 250,000 km of communications cable with a capacity of 2.56 Tb/s was completed, and telecommunications reports show that network capacity has increased dramatically since 2002. 4.3 Comparison with electrical transmission For a specific communication system, there are several things to decide to use optic fiber or copper. Optical fiber is often used in long-distance and high-bandwidth application, because of its’ advantage of high transmission capacity and low interference. Another important advantage of optic fiber is the fibers can combine together even crossing a very long distance and fibers do not generate cross-talk each other, and this is on the other way of copper-based communication. However, for short-distance and low-bandwidth communication, there are some advantages below by using electrical signals: Lower material cost, where large quantities are not required Lower cost of transmitters and receivers Capability to carry electrical power as well as signals (in specially-designed cables) Ease of operating transducers in linear mode. Optical Fibers are more difficult and expensive to splice. At higher optical powers, Optical Fibers are susceptible to fiber fuse wherein a bit too much light meeting with an imperfection can destroy several meters per second. The installation of fiber fuse detection circuity at the transmitter can break the circuit and halt the failure to minimize damage. In some specific low-bandwidth case, optic fiber has its own advantage, as shown below: Immunity to electromagnetic interference, including nuclear electromagnetic pulses (although fiber can be damaged by alpha and beta radiation). High electrical resistance, making it safe to use near high-voltage equipment or between areas with different earth potentials. Lighter weight—important, for example, in aircraft. No sparks—important in flammable or explosive gas environments. Not electromagnetically radiating, and difficult to tap without disrupting the signal—important in high-security environments. Much smaller cable size—important where pathway is limited, such as networking an existing building, where smaller channels can be drilled and space can be saved in existing cable ducts and trays. Conclusion In this paper, we realize the definition of depth, and know how to estimate depth through LCT method. Moreover, we can do focus recovery after finding the depth. Because Fresnel transform requires us to calculate the value of every point of image through the aperture, it cost a lot of computation. That is why we use LCT to approximate the result. We accept a bit of distortion and when we do LCT transform, the output image may change the phase and have lower resolution. Then, we can inverse the parameters produced by LCT transform. In last chapter, we introduce the development of optical communication. We describe the communication schema briefly and then discuss applications of fiber-optic communication. Finally, we make a comparison with fiber-optic communication and electrical transmission. References [1] J. J. Ding, Research of Fractional Fourier Transform and Linear Canonical Transform, Doctoral Dissertation, National Taiwan University, chapter 7, pp 117-123, 2001 [2] Ming-Hsien Chou , “Depth Estimation and Focus Recovery ” , chapter1-chapter3 [3] Jiun-De Huang, “Optical Frequency Mixers Using Three-wave Mixing For Optical Fiber Communication”, 1999 [4] From Wikipedia, http://en.wikipedia.org/wiki/Fiber-optic_communication [5] Chieh-Chih Chen , “A Study Of Depth Estimation On a Pc-based Real-time Stereo Vision System”
