Regression Analysis Exercise
advertisement
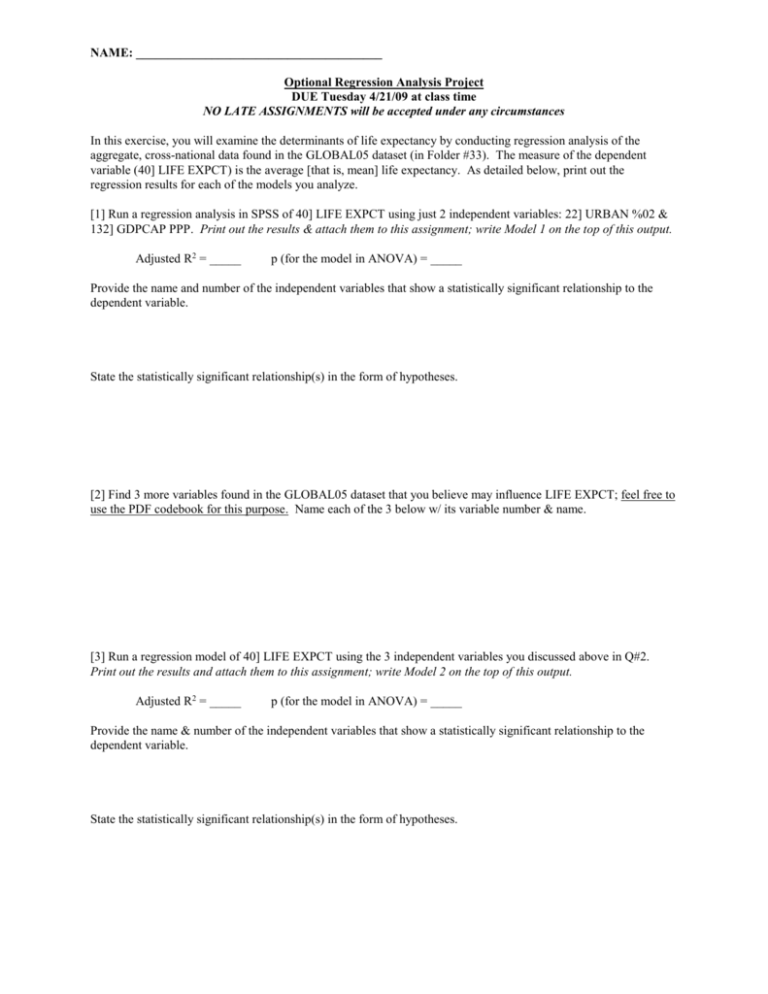
NAME: _______________________________________ Optional Regression Analysis Project DUE Tuesday 4/21/09 at class time NO LATE ASSIGNMENTS will be accepted under any circumstances In this exercise, you will examine the determinants of life expectancy by conducting regression analysis of the aggregate, cross-national data found in the GLOBAL05 dataset (in Folder #33). The measure of the dependent variable (40] LIFE EXPCT) is the average [that is, mean] life expectancy. As detailed below, print out the regression results for each of the models you analyze. [1] Run a regression analysis in SPSS of 40] LIFE EXPCT using just 2 independent variables: 22] URBAN %02 & 132] GDPCAP PPP. Print out the results & attach them to this assignment; write Model 1 on the top of this output. Adjusted R2 = _____ p (for the model in ANOVA) = _____ Provide the name and number of the independent variables that show a statistically significant relationship to the dependent variable. State the statistically significant relationship(s) in the form of hypotheses. [2] Find 3 more variables found in the GLOBAL05 dataset that you believe may influence LIFE EXPCT; feel free to use the PDF codebook for this purpose. Name each of the 3 below w/ its variable number & name. [3] Run a regression model of 40] LIFE EXPCT using the 3 independent variables you discussed above in Q#2. Print out the results and attach them to this assignment; write Model 2 on the top of this output. Adjusted R2 = _____ p (for the model in ANOVA) = _____ Provide the name & number of the independent variables that show a statistically significant relationship to the dependent variable. State the statistically significant relationship(s) in the form of hypotheses. [4] Run a regression model of 40] LIFE EXPCT using the 3 independent variables you discussed above in Q#2 and the 2 independent variables named in Q#1. Print out the results and attach them to this assignment; write Model 3 on the top of this output. Adjusted R2 = _____ p (for the model in ANOVA) = _____ Provide the name & number of the independent variables that show a statistically significant relationship to the dependent variable. State the statistically significant relationship(s) in the form of hypotheses. [5] Run a regression model of 40] LIFE EXPCT using only the independent variables that proved significant in 1 or more of the models analyzed in Q#1,3, & 4 above. Print out the results and attach them to this assignment; write Model 4 on the top of this output. Adjusted R2 = _____ p (for the model in ANOVA) = _____ Provide the name & number of the independent variables that show a statistically significant relationship to the dependent variable. State the statistically significant relationship(s) in the form of hypotheses. [6] Which of these 4 regression models accounts for the most variation in 40] LIFE EXPCT? Why & how do you conclude this? Be specific about your reasoning.
