Exam A – answers - MDC Faculty Home Pages
advertisement
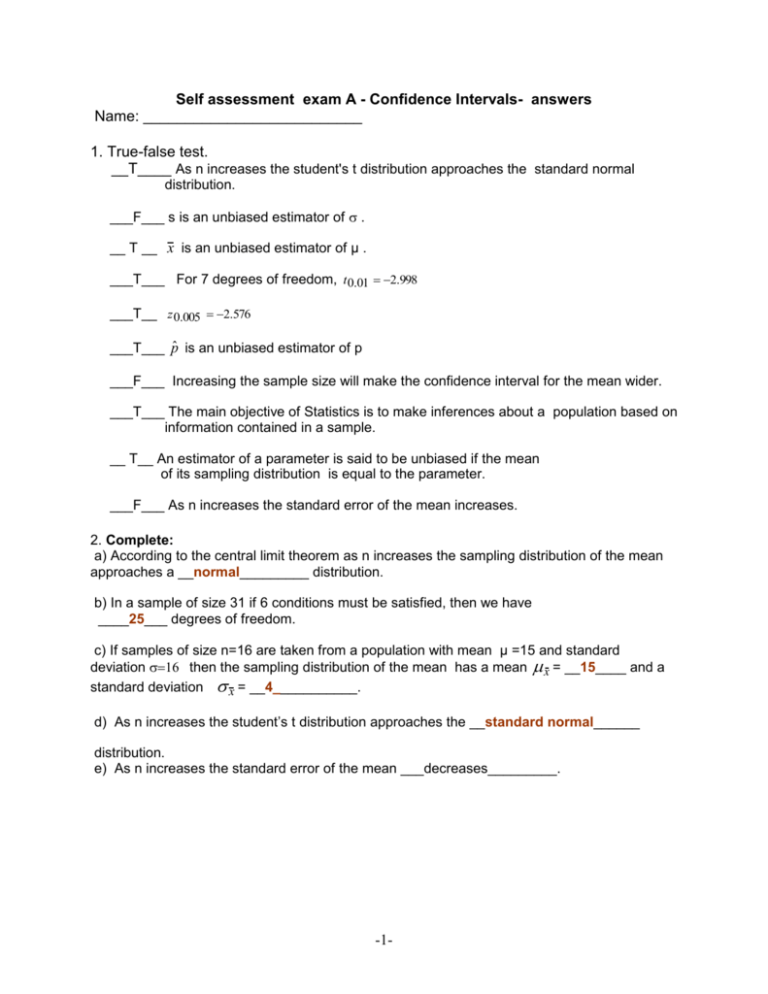
Self assessment exam A - Confidence Intervals- answers Name: __________________________ 1. True-false test. __T____ As n increases the student's t distribution approaches the standard normal distribution. ___F___ s is an unbiased estimator of . __ T __ x is an unbiased estimator of µ . ___T___ For 7 degrees of freedom, t 0.01 2.998 ___T__ z 0.005 2.576 ___T___ pˆ is an unbiased estimator of p ___F___ Increasing the sample size will make the confidence interval for the mean wider. ___T___ The main objective of Statistics is to make inferences about a population based on information contained in a sample. __ T__ An estimator of a parameter is said to be unbiased if the mean of its sampling distribution is equal to the parameter. ___F___ As n increases the standard error of the mean increases. 2. Complete: a) According to the central limit theorem as n increases the sampling distribution of the mean approaches a __normal_________ distribution. b) In a sample of size 31 if 6 conditions must be satisfied, then we have ____25___ degrees of freedom. c) If samples of size n=16 are taken from a population with mean µ =15 and standard deviation then the sampling distribution of the mean has a mean x = __15____ and a standard deviation x = __4___________. d) As n increases the student’s t distribution approaches the __standard normal______ distribution. e) As n increases the standard error of the mean ___decreases_________. -1- 3. A cigarette manufacturer claims that the mean nicotine content in its king-size cigarettes is 2.1 mg with a standard deviation equal to 0.35 mg. If this claim is valid, what is the approximate probability that a sample of 25 cigarettes will yield a mean nicotine content exceeding 2.03 mg? 2.1 mg, 0.35 0.35 0.35 Distributi on of x : n 25, x 2.1, x 0.07 5 25 P( x 2.03) normalcdf (2.03, 10 99 , 2.1, 0.07) 0.8413447404 answer: _0.8413447404____ 4. The weight of food packed in certain containers is a random variable with a mean weight of 16 ounces and a standard deviation of 0.6 ounces. If the containers are shipped in boxes of 36, find , approximately, the probability that a randomly selected box will weigh over 585 ounces? 16 ounces, 0.6 ounces 0.6 Distributi on of x : n 36, x 16, x P( sum 585) P( x 36 0.6 0.1, 6 answer: 585 16.25) normalcdf (16.25, 10 99 , 16, 0.1) 0.0062096799 36 answer: 0.0062096799 . 100 cars on a thruway are clocked at an average speed of 63 mph. Construct a 88% confidence interval for the mean speed of all cars on this thruway. Use s=4.2. n 100, x 63, s 4.2, 0.12, z 2 invNorm(0.06) 1.554773593 formula : x z 2 s n 63 (1.55477) 4.2 100 63 0.65 Answer: __We are 88% confident that the mean speed of all cars on this thruway is between __62.35 mph and 63.65 mph___________ 6. We wish to determine the average length of time that an automobile is parked on the campus parking lot, in order to improve the current situation. How large a sample is needed, in order to make a statement with a 99% confidence that our mean is within 1 hour of the true mean. Assume the population standard 2 deviation is 2.2 hours. 0.01, z z 0.005 invNorm(0.005) 2.575829303, 2.2, E 0.5 2 z n 2 E 2 2 2.5758 2.2 129 0.5 Answer: _n=129_________ -2- 7. A manufacturer of parts believes that approximately 6% of his products contains flaws. If he wishes to estimate the true proportion to within 0.005 and to be certain with a probability of 90% of being correct, how large a sample should he take? 0.10, z z 0.05 invNorm(0.05) 1.644853626, p 0.06, q 0.94, E 0.005 2 n z22 pq E2 1.644852 0.06(0.94) 6104 (0.005) 2 Answer: _6104__________ 8. A random sample of 400 citizens in a community showed that 300 favored having their water fluoridated. Use these data to find a 98% confidence for the proportion of the population favoring fluoridation. x 300 3 n 400, x 300, pˆ 0.75, qˆ 0.25 n 400 4 0.02, z 2 z 0.01 invNorm(0.01) 2.326347877 pˆ qˆ (0.75)(0.25) 0.75 2.326347877 0.75 0.0503666909 n 400 (0.70, 0.80) approximately. answer: based on the random sample of 400 citizens we are 98% confident that the proportion of the population favoring fluoridation is anywhere between 70% and 80%. Formula : pˆ z 2 9. A set of 12 experimental animals was fed a special diet for 3 weeks and produced the following gains in weight: 30, 25, 31, 26, 25, 40, 35, 32, 32, 33, 28, 30 pounds. Find a 99% confidence interval for the population mean gain in weight, assuming that gain in weight is a normal variable. Solution: x 365 30.5833, s 2 n 12, x x 2 n 12 s 30.0833 5.4848 x 2 n 1 n 11433 11 365 2 12 30.0833 0.01, t , 11 T , eq : 0 tcdf (10 9 , T ,11) 0.005 solve T t 3.105806513 2 Formula : x t 2 2 s 30.5833 3.105806513 5.4848 n 30.5833 4.9175, (25.6658, 35.5008) 12 answer: we are 99% confident that the population mean gain in weight is between 25.6658 and 35.5008 pounds. -3- . In a study to estimate the proportion of residences in Stoney Creek and its suburbs that subscribe to Writer's digest, it is found that 60 of 100 urban residences subscribe while only 80 of 125 suburban residences subscribe. Find a 99% confidence interval for the difference in the proportion of urban and suburban residences that subscribe to writer's digest. Solution: Urban n1 100 x1 60 pˆ1 60 / 100 0.60 10 n1 125 Suburban ˆ 2 80 / 125 p x2 80 0.01 / 2 0.005, z0.005 invNorm(0.005) 2.575829303 pˆ 1 pˆ 2 z / 2 pˆ 1qˆ1 pˆ 2 qˆ 2 0.60 0.64 2.5758 n1 n2 0.60(0.40) 0.64(0.36) 100 125 0.04 2.5758(0.06513984960) 0.04 0.17 0.21 p1 p 2 0.13 Conclusion : With a 99% confidence we conclude that the proportion of urban residences that subscribe to writer's digest could be as much as 21% lower or as much 13% higher than the proportion of suburban residences who subscribe. A sample of 50 men studying statistics shows an average grade of 80 points with a standard deviation of 5 points. A sample of 40 women studying statistics shows an average grade of 85 points with a standard deviation of 6 points. Use the given sample to construct a 98% confidence interval for the difference in average grade between all men and women who study statistics. 11. Men n1 50 1 =80 1 5 Women n2 40 2 =85 2 6 0.02 / 2 0.01, z0.01 invNorm(0.01) 2.326347877 x1 x 2 z / 2 12 n1 22 n2 80 85 2.3263 25 36 50 40 5 2.3263( 1.4 ) 5 2.32631.1832 5 2.753 7.753 1 2 2.247 Conclusion : With a 98% confidence we conclude that the average grade in statistics for men s is below the average grade of women by anywhere between 2.247 and 7.753 points. -4-
