Some “rules” for writing the results of ANOVAs
advertisement
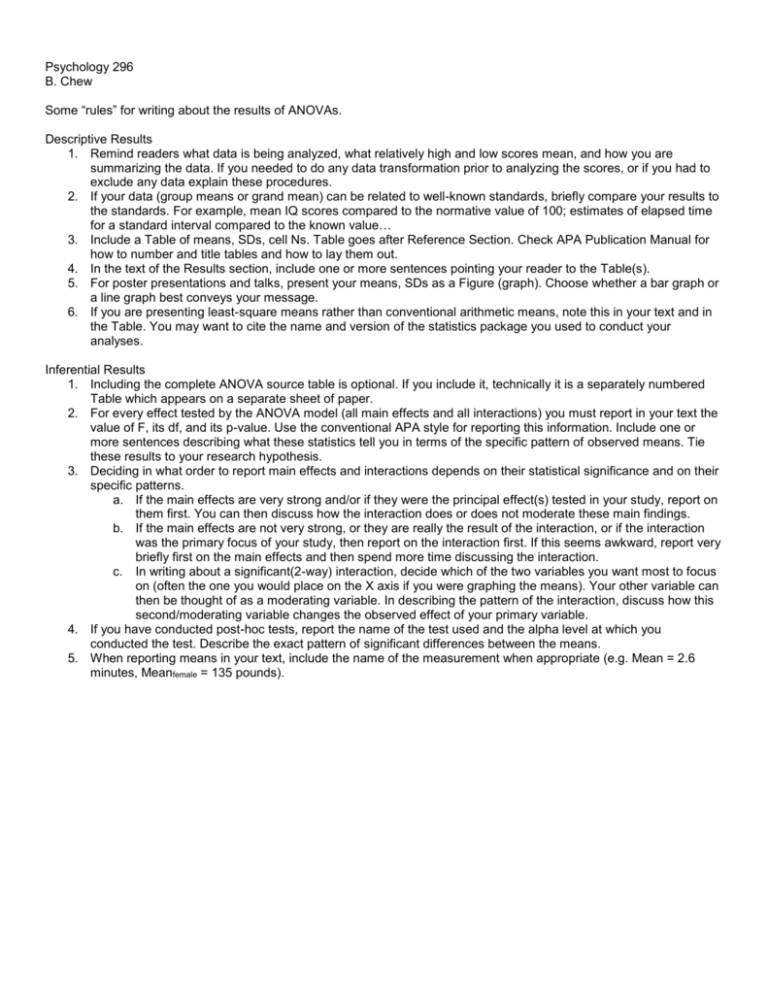
Psychology 296 B. Chew Some “rules” for writing about the results of ANOVAs. Descriptive Results 1. Remind readers what data is being analyzed, what relatively high and low scores mean, and how you are summarizing the data. If you needed to do any data transformation prior to analyzing the scores, or if you had to exclude any data explain these procedures. 2. If your data (group means or grand mean) can be related to well-known standards, briefly compare your results to the standards. For example, mean IQ scores compared to the normative value of 100; estimates of elapsed time for a standard interval compared to the known value… 3. Include a Table of means, SDs, cell Ns. Table goes after Reference Section. Check APA Publication Manual for how to number and title tables and how to lay them out. 4. In the text of the Results section, include one or more sentences pointing your reader to the Table(s). 5. For poster presentations and talks, present your means, SDs as a Figure (graph). Choose whether a bar graph or a line graph best conveys your message. 6. If you are presenting least-square means rather than conventional arithmetic means, note this in your text and in the Table. You may want to cite the name and version of the statistics package you used to conduct your analyses. Inferential Results 1. Including the complete ANOVA source table is optional. If you include it, technically it is a separately numbered Table which appears on a separate sheet of paper. 2. For every effect tested by the ANOVA model (all main effects and all interactions) you must report in your text the value of F, its df, and its p-value. Use the conventional APA style for reporting this information. Include one or more sentences describing what these statistics tell you in terms of the specific pattern of observed means. Tie these results to your research hypothesis. 3. Deciding in what order to report main effects and interactions depends on their statistical significance and on their specific patterns. a. If the main effects are very strong and/or if they were the principal effect(s) tested in your study, report on them first. You can then discuss how the interaction does or does not moderate these main findings. b. If the main effects are not very strong, or they are really the result of the interaction, or if the interaction was the primary focus of your study, then report on the interaction first. If this seems awkward, report very briefly first on the main effects and then spend more time discussing the interaction. c. In writing about a significant(2-way) interaction, decide which of the two variables you want most to focus on (often the one you would place on the X axis if you were graphing the means). Your other variable can then be thought of as a moderating variable. In describing the pattern of the interaction, discuss how this second/moderating variable changes the observed effect of your primary variable. 4. If you have conducted post-hoc tests, report the name of the test used and the alpha level at which you conducted the test. Describe the exact pattern of significant differences between the means. 5. When reporting means in your text, include the name of the measurement when appropriate (e.g. Mean = 2.6 minutes, Meanfemale = 135 pounds). Example: Assume that most previous research had looked at the effect of music tempo on subject’s perception of elapsed time. These studies tended to find that time estimates were higher for slow-tempo than for fast-tempo music. Your contribution in your research is to add the variable of “type of music” to see if the already established effect of tempo varies depending on type of music. [i.e. your primary interest is a test of an interaction.] You would want to write up your results along the following lines: The subjects’ estimates of how much time had elapsed while they were listening to music were recorded to the nearest one-half minute and analyzed with a 2 (music-tempo) by 3 (music-type) completely between subjects ANOVA. Table 1 shows the condition means, standard deviations and sample sizes. Table 2 presents the complete ANOVA source table. Since the sample sizes of the four experimental conditions were not all equal, the ANOVA used a least-squares means analysis (JMP-In, version 3.0). The main effect (marginal) means shown in Table 1 are these least squares estimates. Overall, subjects tended to slightly underestimate how much time had elapsed. The actual music selection lasted 3.0 minutes, however, on average across all conditions, subjects believed about 2.6 minutes had passed. Music-tempo, music-type, and the interaction of the two variables appeared to influence the time estimates. As predicted from previous research, a main effect of music-tempo was observed. Overall, subjects who listened to slow-tempo music estimated that more time had elapsed than did subjects who listened to fast-tempo music, Meanslow = 2.8 minutes versus Meanfast = 2.4 minutes, F(1, 54) = 4.2, p = 0.04. Also, as expected, there was a tendency for the type of music presented to affect the estimate of elapsed time although this main effect did not quite reach the 0.05 level of significance, F(2,54) = 2.0, p = 0.07. The mean time estimate for subjects exposed to classical music appeared to be longer than the mean for either the rock or country-western groups, Meanclassical = 2.9, Meanrock = 2.5, MeanC-W = 2.4 Most central to the purpose of this study was the observation of a statistically significant interaction between musictempo and music-type. As predicted, the effect of music-tempo was not the same for each of the three types of music, F(2, 54) = 6.5, p < 0.01. Inspection of the condition means (see Table 1) suggested that the expected effect of musictempo on time estimation (slow > fast) occurred only for the classical music condition. The tempo effect was essentially non-existent for rock music and small if not actually reversed (slow < fast) for the country western music condition. [Note: technically needs post-hoc tests here to confirm which pairs of means really do differ.] Clearly, any conclusions about how music tempo impacts estimates of the passage of time need to take into account the type of music being played. (Put each Table on a separate page after Reference section. Table really should include SDs and Ns) Table 1 Mean Elapsed Time Estimates as a Function of Music-Tempo and Music-Type Type of Music Music Tempo Fast Slow Rock Country-Western Classical Mean 2.4 2.0 4.0 2.8 2.6 2.8 1.8 2.4 Mean 2.5 2.4 2.9 2.6 Table 2 Source Table for 2 (Music-Tempo) x 2 (Music-Type) Completely Between-Subjects ANOVA Source Music Type Music Tempo Type*Tempo Error Total SS 8.0 8.4 26.0 108.0 150.4 df 2 1 2 54 59 MS 4.0 8.4 13.0 2.0 F 2.0 4.2 6.5 p 0.07 0.04 <0.01
