Uncertainties
advertisement
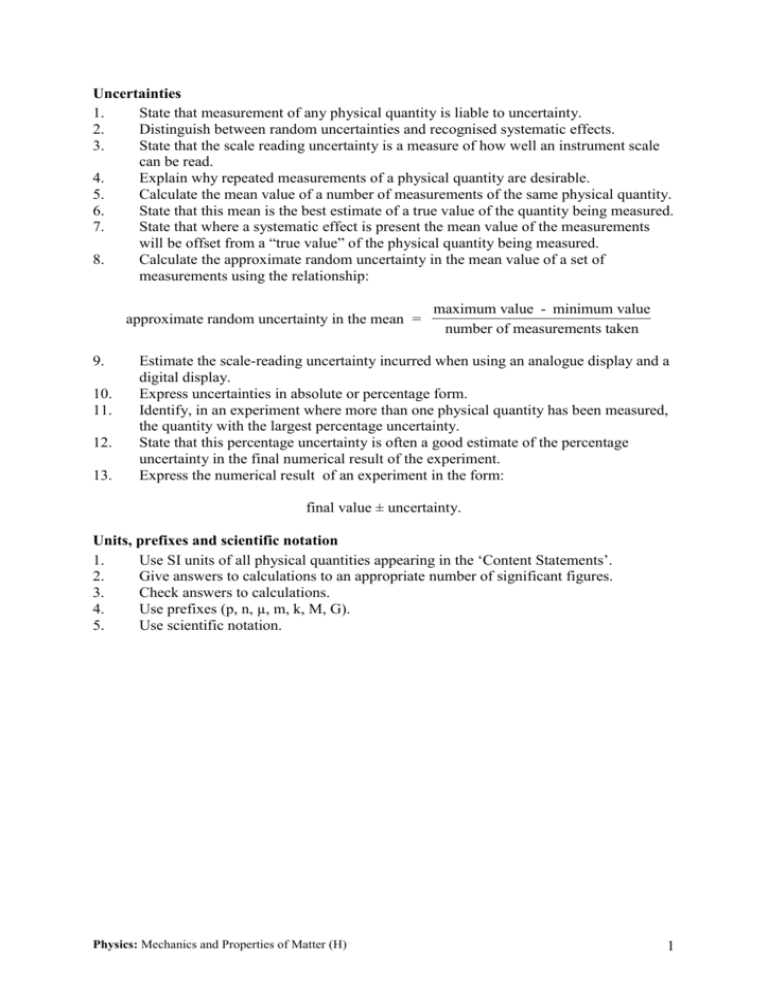
Uncertainties 1. State that measurement of any physical quantity is liable to uncertainty. 2. Distinguish between random uncertainties and recognised systematic effects. 3. State that the scale reading uncertainty is a measure of how well an instrument scale can be read. 4. Explain why repeated measurements of a physical quantity are desirable. 5. Calculate the mean value of a number of measurements of the same physical quantity. 6. State that this mean is the best estimate of a true value of the quantity being measured. 7. State that where a systematic effect is present the mean value of the measurements will be offset from a “true value” of the physical quantity being measured. 8. Calculate the approximate random uncertainty in the mean value of a set of measurements using the relationship: approximate random uncertainty in the mean = 9. 10. 11. 12. 13. maximum value - minimum value number of measurements taken Estimate the scale-reading uncertainty incurred when using an analogue display and a digital display. Express uncertainties in absolute or percentage form. Identify, in an experiment where more than one physical quantity has been measured, the quantity with the largest percentage uncertainty. State that this percentage uncertainty is often a good estimate of the percentage uncertainty in the final numerical result of the experiment. Express the numerical result of an experiment in the form: final value ± uncertainty. Units, prefixes and scientific notation 1. Use SI units of all physical quantities appearing in the ‘Content Statements’. 2. Give answers to calculations to an appropriate number of significant figures. 3. Check answers to calculations. 4. Use prefixes (p, n, µ, m, k, M, G). 5. Use scientific notation. Physics: Mechanics and Properties of Matter (H) 1 Uncertainties UNCERTAINTIES It is important to realise a degree of uncertainty is associated with any measured physical quantity. Systematic Effects These can occur when the measurements are affected all in the same way e.g. a metre stick might have “shrunk”, thus giving consistently incorrect readings. At this level, the systematic effect tends to be small enough to be ignored. Where accuracy is of the utmost importance, the apparatus would be calibrated against a known standard. Note that a systematic effect might also be present if the experimenter is making the same mistake each time in taking a reading. Random Uncertainty Random fluctuations can affect measurements from reading to reading, e.g. consecutive timings of the period of a pendulum can differ. The best estimate of the true value is given by repeating the readings and then calculating the mean value. The random uncertainty is then calculated using the formula below. Random uncertainty = maximum reading - minimum reading number of readings Scale Reading Uncertainty This value indicates how well an instrument scale can be read. An estimate of reading uncertainty for an analogue scale is generally taken as: ± half the least division of the scale. Note: for widely spaced scales, this can be a little pessimistic and a reasonable estimate should be made. For a digital scale it is taken as ± 1 in the least significant digit displayed. Examples 6 7 cm 10 0 m (6.60 + 0.05) cm (9.0 Length lies between (6.55 and 6.65) cm Length lies between (8.5 and 9.5) m Physics: Uncertainties and Prefixes (H) + 0.5) m 8.94 s (8.94 + 0.01) s Time lies between (8.93 and 8.95) s. 1 Uncertainties Example The times for 10 swings of a pendulum are: 1.1, 1.4, 1.2, 1.3 and 1.1 s Mean value = 1.2 s Random uncertainty = maximum - minimum 1.4 - 1.1 = = 0.06 s number of readings 5 Time for 10 swings = (1.2 ± 0.1) s = 1.2 s ± 5 % Note: when the uncertainty is expressed in units then it is known as the absolute uncertainty. In this case this is + 0.06 s, or ± 0.1 s. Comparison of Uncertainties When comparing uncertainties, it is important to take the percentage in each. Suppose in an experiment the following uncertainties were found. Systematic = 0.1 % Scale Reading = 2% Random = 0.5 % The overall uncertainty should be taken as the highest percentage uncertainty. In this case, this would be the reading uncertainty at 2 %. Note: since accuracy is now being quantified, it is essential when using a calculator that all the figures are not taken down, since every number stated indicates the degree of accuracy. As a general rule, your answer should contain the same number of significant figures as the least accurate reading. Examples 1. Refer to the example at the top of the page. The mean value is 1.22 s and the random uncertainty 0.06 s. However, all the readings are to two significant figures hence the final answer must be written as (1.2 ± 0.1)s as shown. 2. Calculate the average speed and absolute uncertainty from the following readings. s = (1.54 ± 0.02) m t = (1.69 ± 0.01) s 0.02 100 % uncertainty in s = 1.54 % uncertainty in t = 0.01 100 1.69 = 1.3 % = 0.6 % Highest uncertainty taken = 1.3 % s 1.54 = = = 0.911 ms-1 1.3% v t 1.69 1.3 % of 0.911 m s-1 = 0.012 m s-1 (converts % to absolute uncertainty) v = (0.91 ± 0.01) m s-1 Physics: Uncertainties and Prefixes (H) 2 Uncertainties ACTIVITY Title: Uncertainties Aim: to find the average speed of a trolley moving down a slope, estimating the uncertainty in the final value. Apparatus: 1 ramp, 1 metre stick, 1 trolley, 1 stop clock. Instructions Set up a slope and mark two points 85 cm apart. Note the scale reading uncertainty. Calculate the percentage uncertainty in the distance. Ensuring the trolley starts from the same point each time, measure how long it takes the trolley to pass between the two points. Repeat 5 times, calculate the mean time and estimate the random uncertainty. Note the scale reading uncertainty in the time. Calculate the percentage uncertainty in the time. Calculate the average speed and associated uncertainty. Express your result in the form: (speed ± absolute uncertainty) m s-1 Physics: Uncertainties and Prefixes (H) 3 Uncertainties Problems 1. Calculate the percentage uncertainties for the following absolute readings: a) (4.65 ± 0.05) V b) (892 ± 5) cm c) (1.8 ± 0.4) A d) (2.87 ± 0.02) s e) (13.8 ± 0.5) Hz f) (5.2 ± 0.1) m. 2. State the three types of uncertainty, explaining the difference between them. 3. Manufacturers of resistors state the uncertainty in their products by using colour codes. Gold - 5 % accuracy. Silver - 10 % accuracy. Calculate the possible ranges for the following resistors for each colour. a) 1 k b) 10 k c) 22 4. For each of the following scales, write down the reading and estimate the uncertainty. 5. Calculate the mean time and random uncertainty for the following readings: 0.8 s, 0.6 s, 0.5 s, 0.6 s and 0.4 s. 6. A student uses light gates and suitably interfaced computer to measure the acceleration of a trolley as it moves down a slope. The following results were obtained. a / m s-2 5.16, 5.24, 5.21, 5.19, 5.12, 5.20, 5.17, 5.19. Calculate the mean acceleration and the corresponding random uncertainty. 7. AB is measured using a metre stick. A trolley is timed between AB. The following results were obtained. AB = (60.0 + 0.1) cm t/s 1.21, 1.21, 1.26, 1.27, 1.24 and 1.28. Express the average speed in the form (value ± absolute uncertainty). Physics: Uncertainties and Prefixes (H) 4 Uncertainties Solutions 1. (a) uncertainty = 0.05 100 = 1.1 % 4.65 (d) 0.7 % 2. (c) 22 % (e) 3.6 % (f) 1.9 % Systematic effect: affects all readings in the same way. Can be due to apparatus limitations or fault in experimental approach. Reading uncertainty: accuracy limited by quality of scale ± half the least division (analogue) or good estimate. ± 1 in the least significant digit (digital). Random uncertainty: random fluctuations between readings. Effect is minimised by repeating readings. Uncertainty = maximum reading - minimum reading number of readings 3. (a) Gold 5 % of 1k = 0.05 k Silver 10 % of 1k = 0.1k (b) Silver (9000 - 11000) (c) Silver (19.8 - 24.2) 4. (a) ( 3.2 ± 0.1) mm (d) (2.4 ± 0.2) g (g) (195 ± 1) mA 5. (b) 0.6 % Range is (0.95 - 1.05) k Range is (0.9 -1.1) k Gold (9500 - 10500) Gold (20.9 - 23.1) (b) (2.30 ± 0.05) cm (e) (7.84 ± 0.01) s = (950 - 1050) = (900 - 1100) (c) (0.250 ± 0.005) 0C (f) (1.005 ± 0.001) s (0.8 + 0.6 + 0.5 + 0.6 + 0.4) = 0.6 s 5 (0.8 - 0.4) Random uncertainty = = 0.08 s 5 Mean time = t = (0.6 ± 0.1) s 6. 7. Mean a = 5.19 m s-2 5.24 - 5.12 = 0.015 ms-2 8 a = (5.19 ± 0.02) m s-2 Random error = AB = (60.0 ± 0.1) cm = 60 cm ± 0.17 % 1.28 - 1.21 Random uncertainty in t = = + 0.012 s 6 Mean t = (1.25 ± 0.01) s = 1.25 s ± 0.8 % Greatest percentage uncertainty is 0.8 % in the time. v= s 6.0 = ± 0.8% = 48.0 cm s-1 ± 0.8% = (48.0 ± 0.4) m s-1 t 1.25 Physics: Uncertainties and Prefixes (H) 5 Uncertainties Physics: Uncertainties and Prefixes (H) 6


