Mean, Median and Mode - Jackmathsolutions.com
advertisement
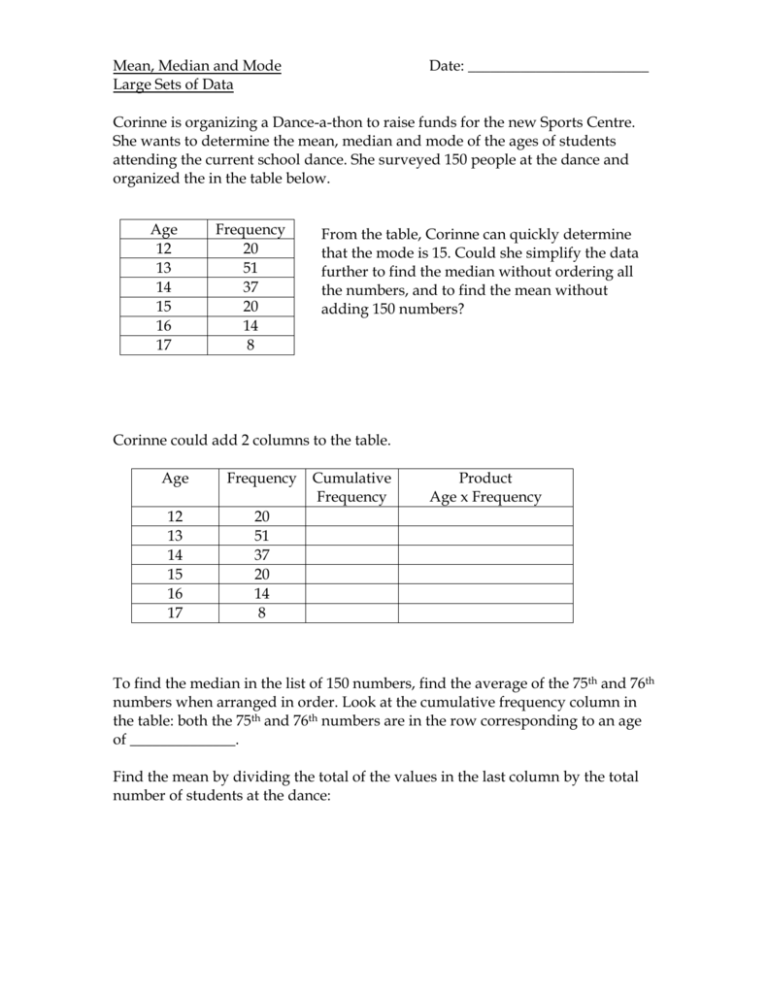
Mean, Median and Mode Large Sets of Data Date: ________________________ Corinne is organizing a Dance-a-thon to raise funds for the new Sports Centre. She wants to determine the mean, median and mode of the ages of students attending the current school dance. She surveyed 150 people at the dance and organized the in the table below. Age 12 13 14 15 16 17 Frequency 20 51 37 20 14 8 From the table, Corinne can quickly determine that the mode is 15. Could she simplify the data further to find the median without ordering all the numbers, and to find the mean without adding 150 numbers? Corinne could add 2 columns to the table. Age Frequency 12 13 14 15 16 17 20 51 37 20 14 8 Cumulative Frequency Product Age x Frequency To find the median in the list of 150 numbers, find the average of the 75th and 76th numbers when arranged in order. Look at the cumulative frequency column in the table: both the 75th and 76th numbers are in the row corresponding to an age of ______________. Find the mean by dividing the total of the values in the last column by the total number of students at the dance: The TI-83 can also be used to verify the mean and the median. i) Enter the age in L1. ii) Enter the frequency in L2. iii) Enter 1-Var Stats L1, L2 then press ENTER Mean, Median and Mode Large Sets of Data – Homework Date: ________________________ 1) The table shows the number of children, classified by age, attending 2 summer camps. Havergal Day Camp: Age Frequency 4 5 6 7 45 75 90 105 Biffy’s Summer Bonanza: Cumulative Frequency Age Frequency 4 5 6 7 35 55 85 75 Cumulative Frequency a) State the mode of the children’s ages for each camp. b) State the mean and median age for each camp. c) Verify your results using the TI-83. 2) The numbers below represent the number of items in a set of data. If the data have been arranged in ascending order, state the number of the item that would give the median. a) 25 b) 100 c) 45 d) 32 3) Katherine tries to predict the outcome of hockey games. To help with the predictions, Katherine collected data about the number of goals scored by the winning team in each of the last 120 games. Extend the table to include the cumulative frequency and product columns. Use the data to find the mean, median, and mode for goals scored per game. Verify your result using the TI-83. e) 54 Goals 1 2 3 4 5 6 7 8 f) 63 Frequency 5 9 14 29 26 24 10 3 4) The prizes in a lottery were as follows: Prize ($) 100 000 75 000 7 500 750 25 Extend the table to include the cumulative frequency and the product. Use the table to find the mean, median and mode value of the prizes. Which measure seems best to describe the average value of the prizes? Verify your results using the TI-83. Frequency 5 2 102 102 53 000 5) a) The marks of 32 mathematic students on Test 1 are all multiples of 10 and are shown on the bar graph. What was the average (mean) mark of the 32 students in the class? Marks on Test 1 10 9 8 7 6 Number of Stude nts 5 4 3 2 1 0 10 20 30 40 50 60 70 80 90 100 Ma rk s (out of 1 00) b) After his first 6 tests, Paul had an average of 86. What will his average be if he scores 100 on his next test? c) Later in the year, Mary realizes that she needs a mark of 100 on the next test in order to achieve an average of 90 for all her tests. However, if she gets a 70, her average will be 87. After the next test, how many tests will she have written? Selected Answers: 1b) MeanHDC = 5.81, Median HDC = 6 MeanBSB = 5.8, Median BSB = 6 2a) 13 b) 50.5 c) 23 d) 16.5 e) 27.5 f) 32 3) Mean = 4.575, median = 5, mode = 4 4) Mean = 52.93, Median = 25, Mode = $25


