Appendix S1: Details of the mathematical modeling
advertisement
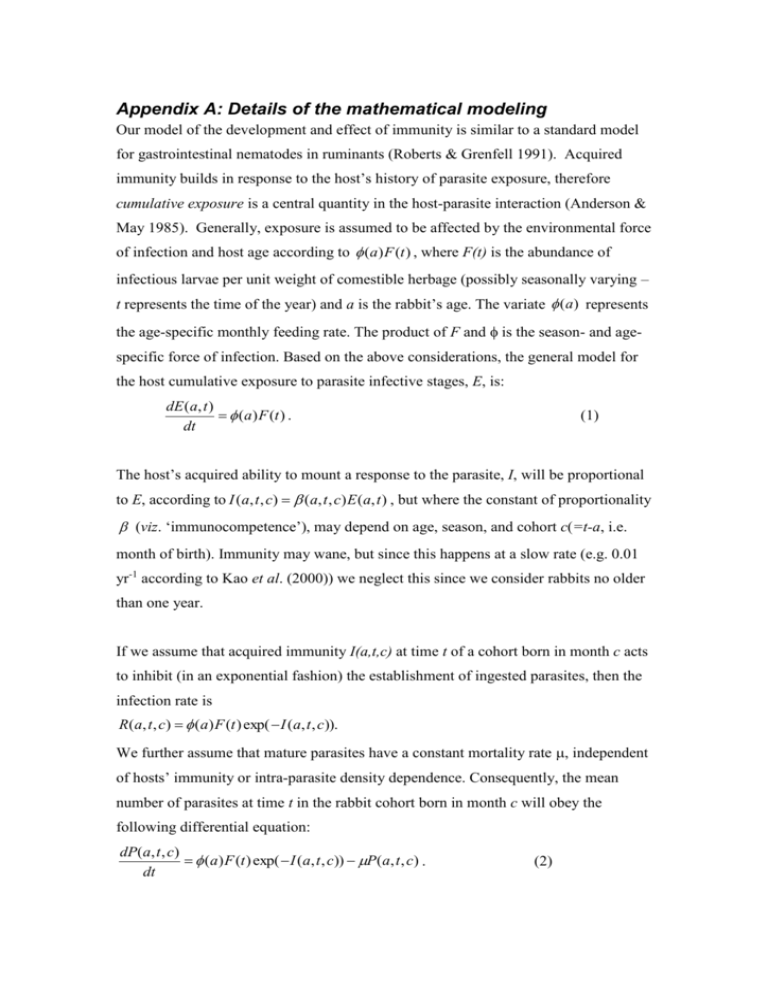
Appendix A: Details of the mathematical modeling
Our model of the development and effect of immunity is similar to a standard model
for gastrointestinal nematodes in ruminants (Roberts & Grenfell 1991). Acquired
immunity builds in response to the host’s history of parasite exposure, therefore
cumulative exposure is a central quantity in the host-parasite interaction (Anderson &
May 1985). Generally, exposure is assumed to be affected by the environmental force
of infection and host age according to (a) F (t ) , where F(t) is the abundance of
infectious larvae per unit weight of comestible herbage (possibly seasonally varying –
t represents the time of the year) and a is the rabbit’s age. The variate (a) represents
the age-specific monthly feeding rate. The product of F and is the season- and agespecific force of infection. Based on the above considerations, the general model for
the host cumulative exposure to parasite infective stages, E, is:
dE (a, t )
(a) F (t ) .
dt
(1)
The host’s acquired ability to mount a response to the parasite, I, will be proportional
to E, according to I (a, t , c) (a, t , c) E (a, t ) , but where the constant of proportionality
(viz. ‘immunocompetence’), may depend on age, season, and cohort c(=t-a, i.e.
month of birth). Immunity may wane, but since this happens at a slow rate (e.g. 0.01
yr-1 according to Kao et al. (2000)) we neglect this since we consider rabbits no older
than one year.
If we assume that acquired immunity I(a,t,c) at time t of a cohort born in month c acts
to inhibit (in an exponential fashion) the establishment of ingested parasites, then the
infection rate is
R(a, t , c) (a) F (t ) exp( I (a, t , c)).
We further assume that mature parasites have a constant mortality rate , independent
of hosts’ immunity or intra-parasite density dependence. Consequently, the mean
number of parasites at time t in the rabbit cohort born in month c will obey the
following differential equation:
dP(a, t , c)
(a) F (t ) exp( I (a, t , c)) P(a, t , c) .
dt
(2)
Equations (1)-(2) represent our general model of parasite exposure and establishment.
For model fitting and data analysis, however, we need to specify the functional forms
of the various components of the model. In particular, we need to define candidate
models for (i) how the force of infection varies through the year, F(t), (ii) how feeding
rates depends on age, (a) , and (iii) how immunocompetence varies among
individuals, ( a, t , c ) . A definition of the model parameters is reported in table 1 of
the MS, and the meaning of the letters used to denote different components of the
models is summarised in table 2.
The force of infection, F, will itself depend on the history of reproductive adult
parasites present in the host population. Since we do not have available data on host
density or a reliable measure of parasite fecundity (which will depend on the hosts
immunity as well as the adults intestinal density), we are unable to model or estimate
the force of infection independently. We therefore use a generic mathematical
expression that encompasses three scenarios for the force of infection:
F (t ) [1 f1 sin( {t 1 3} f p sin[ {t p 3}]) f 2 sin( 2{t 2 3})]
where t is the time in months and
/6 month-1 is the angular frequency
corresponding to annual variation (there is no multiplicative constant in the
expression for F as this would be indistinguishable from a constant in the feeding
rate).
This elaborate expression for the force of infection has the following three possible
scenarios:
(i) Sinusoidal: where p=f2=0, and the parameters f1 and 1 are estimated through
model fitting. This is denoted as model ‘F’, and 1 represents the month where F is
maximal.
(ii) Sinusoidal plus second harmonic (denoted as model ‘FH’): where p=0, and the
parameters f1, f2, 1 and 2 are estimated with model fitting.
(iii) Sinusoidal phase modulation (denoted as model ‘FP’): where f1=0, and the
parameters f1, p, 1 and p are estimated with model fitting. Models FH and FP are
used to assess whether there is any significant non-sinusoidality in the force of
infection, F .
Though the feeding rate varies with rabbit age a, we can only infer individuals’ age
indirectly from their body mass. While this adds some additional uncertainty to the
analysis (discussed in some detail in Cattadori et al., 2005) we believe our results are
robust enough to describe patterns of feeding rate and parasite infection with age. We
use the age/body mass calibration of Cattadori et al. (2005) to obtain the following
allometric model for feeding rate:
0 200 275a 3340
where and are constants. The constant is allowed to be nonzero if the age
dependent feeding rate G is present in the model; the parameter 0 needs to be fitted
whatever the model.
Our previous study on the T. retortaeformis-rabbit interaction highlighted the
occurrence of heterogeneities (mainly related to season, age and sex) in infection
intensity (Cattadori et al. 2005), so here we consider various scenarios for how
immunocompetence varies among individuals:
Age-dependence (A): where A 0 1a . This allows older rabbits to have a higher
immunocompetence than younger individuals. We denote by ‘I’ models where
0 0 and by ‘A’ models where 1 0 .
Season-dependent condition (T): where T (1 1T sin( (t T 3))) , T being the
month in which immunocompetence is maximal. We denote by `S’ models where
1T 0 .
Cohort-dependent immunity (C): where C 1 1C sin( (b C 3)) , C being the
month in which the most immuno-competent rabbits were born.
In total, these components combine to form 72 possible models. We have not tested
all combinations, but the nested structure imposes bounds on the likelihoods that
enable us to reject some of simpler models without explicit fitting.
Statistical procedure
Equation (2) may be interpreted as the first moment of a linear stochastic
immigration-death process, in which case the parasite burdens would be distributed
among hosts as a Poisson distribution with mean P. However, our data, in common
with many macroparasite systems, display aggregated distributions among hosts
(Boag et al. 2001), so when fitting the data we shall assume a negative-binomial
distribution among hosts (Grenfell et al. 1995).
To estimate model parameters, we pick initial values for all parameters and integrate
the differential equations (1) and (2) to give predicted mean infection levels for
rabbits in different age and birth classes. The differential equations are well behaved,
and may be robustly solved using fixed-step numerical integration. The likelihood of
the model is then calculated by assuming that each rabbit’s parasite burden is drawn
from a negative binomial with the predicted mean (appropriate to its age and cohort)
and a shape parameter k. We then use standard multidimensional optimisation
routines (Nelder-Mead Simplex and Conjugate Gradient (Press et al. 1992)) to update
the values for the parameters and find the model parameters for which the likelihood
is maximised. The Akaike Information Criterion (AIC=-2(log likelihood)+2(number
of parameters)) was calculated for each model and the degree, AIC, by which a
model differs from the model with the lowest (best) AIC is used to evaluate the
relative accuracy of these models (Burnham & Anderson 1998). The standard rule of
thumb is that models with AIC values of 0-2 well predict the pattern observed in the
raw data (`good support’), models with values of 4-7 poorly describe the pattern of
the raw data (`some support’), and models with values of 10+ are not reliable (`no
support’).
References
Anderson, R.M. & May, R.M. (1985) Herd immunity to helminth infection and
implications for parasite control. Nature, 315, 493–496.
Boag, B., Lello, J., Fenton, A., Tompkins, D.M. & Hudson, P.J. (2001) Patterns of
parasite aggregation in the wild european rabbit (Oryctolagus cuniculus). Int J
Parasitol, 31, 1421–1428.
Burnham, K.P. & Anderson, D.A. (1998) Model Selection and Inference: a Practical
Information Theoretic Approach. Springer-Verlag, New York.
Cattadori, I.M., Boag, B., Bjørnstad, O.N., Cornell, S.J. & Hudson, P.J. 2005
Immuno-epidemiology and peak shift in a seasonal host-nematode system. Proc
Roy Soc London B 272, 1167-1169.
Grenfell, B.T., Wilson, K., Isham, V.S., Boyd, H.E.G. & Dietz, K. (1995)
Parasitology, 111, S135–S151.
Kao, R.R., Leathwick, D.M., Roberts, M.G. & Sutherland, I.A. (2000) Nematode
parasites of ruminants: a survey of epidemiological parameters and their
application in a simple model. Parasitology, 121, 85–103.
Press, W.H., Teukolsky, S.A., Vetterling, W.T. & Flannery, B.P. (1992) Numerical
Recipes in Fortran: the Art of Scientific Computing, 2nd. Edition, Cambridge
University Press, New York.
Roberts, M.G. & Grenfell, B.T. (1991) The population dynamics of nematode
infections of ruminants: periodic perturbations as a model for management. IMA J
Math Appl Med Biol. 8, 83–93.
