CP70 - Ofcom
advertisement
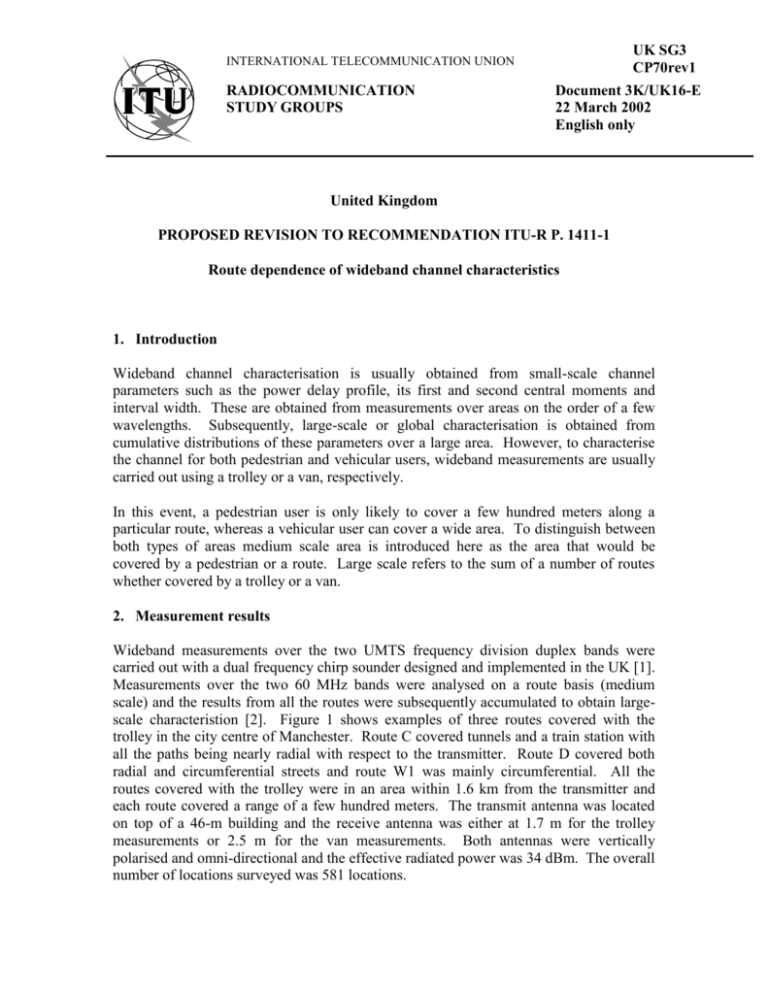
INTERNATIONAL TELECOMMUNICATION UNION RADIOCOMMUNICATION STUDY GROUPS UK SG3 CP70rev1 Document 3K/UK16-E 22 March 2002 English only United Kingdom PROPOSED REVISION TO RECOMMENDATION ITU-R P. 1411-1 Route dependence of wideband channel characteristics 1. Introduction Wideband channel characterisation is usually obtained from small-scale channel parameters such as the power delay profile, its first and second central moments and interval width. These are obtained from measurements over areas on the order of a few wavelengths. Subsequently, large-scale or global characterisation is obtained from cumulative distributions of these parameters over a large area. However, to characterise the channel for both pedestrian and vehicular users, wideband measurements are usually carried out using a trolley or a van, respectively. In this event, a pedestrian user is only likely to cover a few hundred meters along a particular route, whereas a vehicular user can cover a wide area. To distinguish between both types of areas medium scale area is introduced here as the area that would be covered by a pedestrian or a route. Large scale refers to the sum of a number of routes whether covered by a trolley or a van. 2. Measurement results Wideband measurements over the two UMTS frequency division duplex bands were carried out with a dual frequency chirp sounder designed and implemented in the UK [1]. Measurements over the two 60 MHz bands were analysed on a route basis (medium scale) and the results from all the routes were subsequently accumulated to obtain largescale characteristion [2]. Figure 1 shows examples of three routes covered with the trolley in the city centre of Manchester. Route C covered tunnels and a train station with all the paths being nearly radial with respect to the transmitter. Route D covered both radial and circumferential streets and route W1 was mainly circumferential. All the routes covered with the trolley were in an area within 1.6 km from the transmitter and each route covered a range of a few hundred meters. The transmit antenna was located on top of a 46-m building and the receive antenna was either at 1.7 m for the trolley measurements or 2.5 m for the van measurements. Both antennas were vertically polarised and omni-directional and the effective radiated power was 34 dBm. The overall number of locations surveyed was 581 locations. -23K/UK16 Figures 2 and 3 show the concatenated power delay profiles for routes C and W1 for the two frequency bands. The power delay profiles are displayed as a function of received RF power. The figure shows the dependence of the delay spread on the route. This is also seen from figure 4, which shows the delay interval for 15-dB threshold for the three routes for both the uplink and downlink. Figure 5 shows the corresponding large-scale cumulative distribution from all the trolley routes and from the van route. The route dependence of the channel parameters is evident from the two figures and the effect of the overall data pool can also be seen. References: 1. Salous, S., and Gokalp, H., Dual frequency sounder for UMTS frequency division duplex channels, accepted for publication in the IEE Proceedings Communications. 2. Salous, S., Analysis of route and frequency dependence of wideband channel characteristics, URSI-F symposium, February, 2002. D W1 C Transmitter Figure 1. Map of urban measurements. Routes: W1, D, C -33K/UK16 Uplink Downlink Figure 2. Power delay profiles for route C. -43K/UK16 Figure 3. Power delay profiles for route W1. s Figure 4. Cumulative distribution for the three routes of figures 1. -53K/UK16 s Figure 5. Cumulative distribution for all the trolley routes and the van route. -63K/UK16 ANNEX Proposed Revision to Recommendation ITU-R P.1411-1 Section 6, Multipath models After line 2 ending with “ITU-R.1407” Add the following paragraph “The statistics of the delay spread in an urban high-rise environment for small macrocells (as defined in Table 3), have been found to be strongly related to the route of the measurement. This gives rise to three different classifications: small-scale (single location over a few wavelengths), medium scale (short route of a few hundred meters) and large scale (a large area which includes a number of varied routes and can extend to ranges from a few hundred meters to a few km’s). Significant differences can be observed between the medium scale characterisation particularly between radial and circumferential routes. For large scale characterisation a large number of locations should be surveyed in the measurements to obtain an unbiased estimate.”
