Regression practice
advertisement

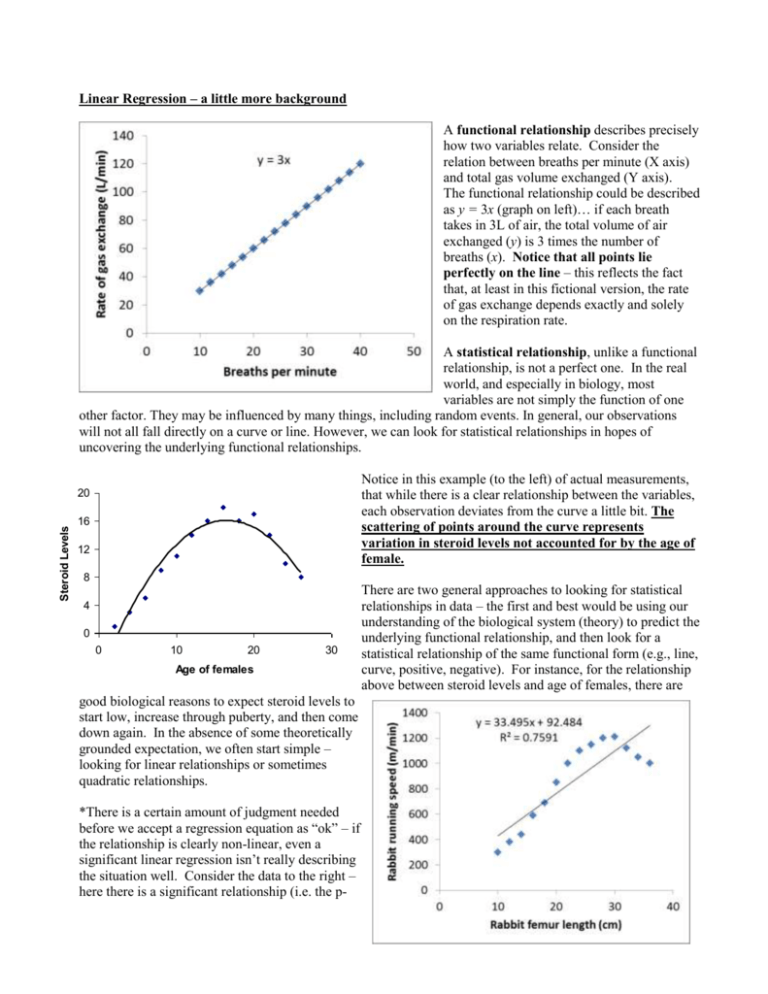
Linear Regression – a little more background A functional relationship describes precisely how two variables relate. Consider the relation between breaths per minute (X axis) and total gas volume exchanged (Y axis). The functional relationship could be described as y = 3x (graph on left)… if each breath takes in 3L of air, the total volume of air exchanged (y) is 3 times the number of breaths (x). Notice that all points lie perfectly on the line – this reflects the fact that, at least in this fictional version, the rate of gas exchange depends exactly and solely on the respiration rate. A statistical relationship, unlike a functional relationship, is not a perfect one. In the real world, and especially in biology, most variables are not simply the function of one other factor. They may be influenced by many things, including random events. In general, our observations will not all fall directly on a curve or line. However, we can look for statistical relationships in hopes of uncovering the underlying functional relationships. Notice in this example (to the left) of actual measurements, that while there is a clear relationship between the variables, each observation deviates from the curve a little bit. The scattering of points around the curve represents variation in steroid levels not accounted for by the age of female. Steroid Levels 20 16 12 8 4 0 0 10 20 30 Age of females good biological reasons to expect steroid levels to start low, increase through puberty, and then come down again. In the absence of some theoretically grounded expectation, we often start simple – looking for linear relationships or sometimes quadratic relationships. *There is a certain amount of judgment needed before we accept a regression equation as “ok” – if the relationship is clearly non-linear, even a significant linear regression isn’t really describing the situation well. Consider the data to the right – here there is a significant relationship (i.e. the p- There are two general approaches to looking for statistical relationships in data – the first and best would be using our understanding of the biological system (theory) to predict the underlying functional relationship, and then look for a statistical relationship of the same functional form (e.g., line, curve, positive, negative). For instance, for the relationship above between steroid levels and age of females, there are value is <0.001) between the length of a rabbits femur (upper leg bone), and the rate at which it can run. The R2 tells us that much of the variation in speed is accounted for by the leg length variable (or, in other words, there is a strong relationship), and the computer can produce a line of best fit and a corresponding equation. But when we look at this graph, clearly something is wrong. The real, underlying functional relationship between the x and y variables is probably not linear… applying linear regression in this case is, thus, not appropriate. Let’s Practice (return to the website explanations of p-value, R2, etc. if needed) 1) Should we conclude there is a relationship between x and y? y 2) Given your answer to #1, should we trust (i.e. use) the regression equation? y = -0.359x + 9.1667 14 12 10 2 R = 0.0405 p = 0.80 8 6 4 2 0 0 2 4 x 6 8 3) Should we conclude that there is a relationship between spider weight and the force that a spider can apply with its mandibles? 4) For every mg of extra weight, how much does change can we expect in mandible force, and in what direction? 5) If a spider weighs 3mg, what mandible force would we expect it to be able to exert, exactly? (Hint: use the regression equation) y 6) Is linear regression appropriate for this dataset? Why or why not? y = -1.7917x + 15.625 16 14 12 10 8 6 4 2 0 2 R = 0.8235 p<0.05 0 2 4 6 x When we carefully examine a regression, we can learn even more. Below is a linear regression of the scores of a first quiz on the x axis and the scores on a second quiz on the y-axis – each point represents one student’s scores. We see a positive trend generally, which means that people who did well on the first test did well on the second…(not surprising!) but we can also see that many points are above the regression line and many are below the line – what does it mean for a point to be above the line? It means that student did better on the second test than we expected, given the overall relationship between first and second scores. 7) What does it mean for a point to be below the regression line? 8 10 We can use the same reasoning in many circumstance – for instance, humans often “stand out” from other organisms in some traits… for instance, to the left is data for brain size (y-axis) vs. body size (x-axis) for lots of species. As you can see, “modern man” stands out, high above the regression line. We have relatively big brains considering our body size…. Notice porpoises and chimps do too. 8) How big are the brains of ostriches, in absolute size? How big are they relative to other vertebrates of similar body size? 9) A data point in a regression analysis relating human arm length (x-axis) to leg length (y-axis) lies above the regression line. Describe this person, relative to a “normal” person. 10) Explain the difference between a functional and statistical relationship.


