chapter10
advertisement

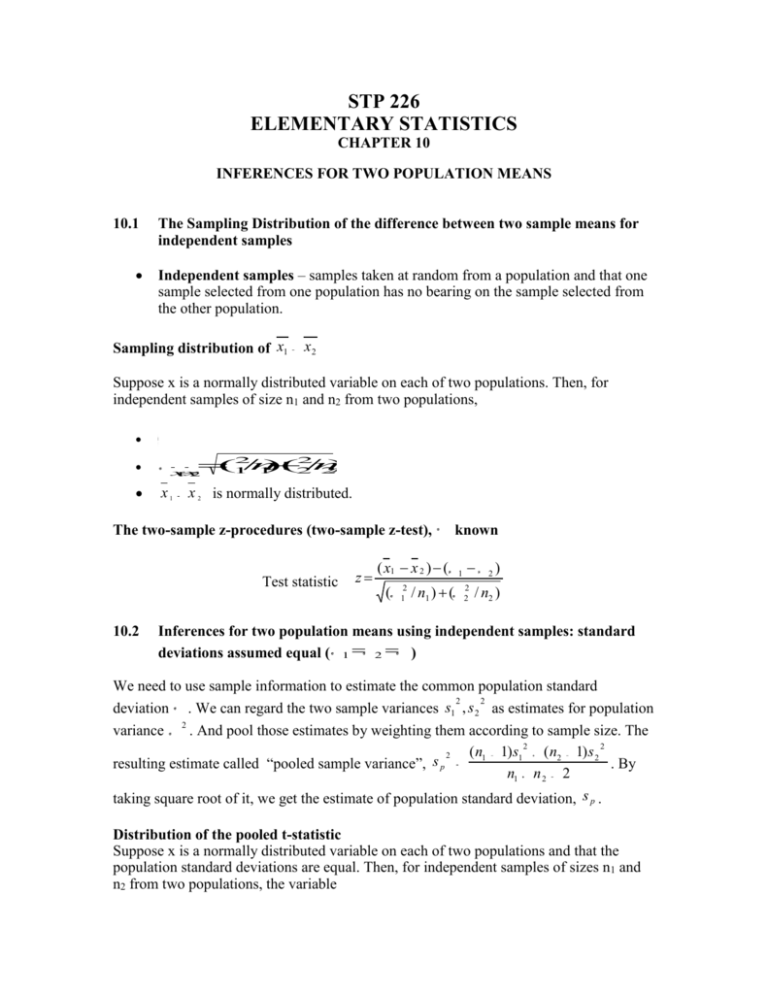
STP 226 ELEMENTARY STATISTICS CHAPTER 10 INFERENCES FOR TWO POPULATION MEANS 10.1 The Sampling Distribution of the difference between two sample means for independent samples Independent samples – samples taken at random from a population and that one sample selected from one population has no bearing on the sample selected from the other population. Sampling distribution of x1 x2 Suppose x is a normally distributed variable on each of two populations. Then, for independent samples of size n1 and n2 from two populations, x1212 2 2 (1 / n ) (2 / n ) 1 2 x x 1 2 x1 x 2 is normally distributed. The two-sample z-procedures (two-sample z-test), Test statistic 10.2 z ( x1 x 2 ) ( ( 2 1 / n1 ) ( known 1 2 2 2 ) / n2 ) Inferences for two population means using independent samples: standard deviations assumed equal ( 1 2 ) We need to use sample information to estimate the common population standard 2 2 deviation . We can regard the two sample variances s1 , s 2 as estimates for population variance 2 . And pool those estimates by weighting them according to sample size. The 2 2 ( n1 1) s1 ( n2 1) s 2 2 s resulting estimate called “pooled sample variance”, p . By n1 n 2 2 taking square root of it, we get the estimate of population standard deviation, s p . Distribution of the pooled t-statistic Suppose x is a normally distributed variable on each of two populations and that the population standard deviations are equal. Then, for independent samples of sizes n1 and n2 from two populations, the variable t ( x1 x 2 ) ( 1 2 ) s p (1/ n1 ) (1 / n2 ) has a t-distribution with df = n1 + n2 - 2 Where 2 sp 2 ( n1 1) s1 ( n2 1) s 2 is the pooled sample standard deviation n1 n2 2 The pooled t-test for two population means ASSUMPTIONS 1. 2. Independent samples Normal populations or large samples 2 12 n,1/2s 3. Equal population standard deviations ( OR ) STEPS 1. 2. 3. The null hypothesis is H0 : 1 = 2 and the alternate hypothesis is one of the following: Ha : 1 2 (two-tailed) Ha : 1 < 2 (left-tailed) Ha : 1 > 2 (right-tailed) Decide on the significance level, . The critical value(s) are t/2 (two-tailed) - t (left-tailed) z (right-tailed) with df = n1 + n2 – 2 , use Table IV to find the critical value(s). x1 x2 t Compute the value of the test statistic s p (1 / n1 ) (1 / n2 ) 4. 2 2 ( n1 1) s1 ( n2 1) s 2 n1 n2 2 If the value of the test statistic falls in the rejection region, reject H0; otherwise, do not reject H0. State the conclusion in words. where 5. 6. sp The hypothesis test is exact for normal populations and is approximately correct for large samples from non-normal populations. The Pooled t-interval procedure for two population means ASSUMPTIONS 1. 2. 3. Independent samples Normal populations or large samples Equal population standard deviations STEPS 1. For a confidence level of 1 - , use Table IV to find t/2 with df = n1 + n2 – 2. 2. The end points of the confidence interval for 1 - 2 are ( x )t . s 1 / n )( 1 / n ) 1x 2 / 2 p( 1 2 The confidence interval is exact for normal populations and is approximately correct for large samples from non-normal populations. What if the assumptions are not satisfied? 1. Not independent samples: If paired, use the procedure in Section 10.4 2. Not normal and small samples: Use nonparametric method, Mann-Whitney test or Mann-Whitney confidence interval. 3. Unequal population standard deviations: If the problem satisfies assumptions 1 and 2, then use the procedure in Section 10.3. 10.3 Inferences for two population means using independent samples (standard deviations not assumed equal) If the population standard deviations are known, use the z-interval procedure/test z ( x1 x 2 ) ( ( 2 1 1 / n1 ) ( 2 2 2 ) / n2 ) Distribution of the non-pooled t-statistic Suppose x is a normally distributed variable on each of two populations. Then, for independent samples of sizes n1 and n2 from the populations, the variable t (x1 x 2 ) (1 2 ) ( s12 / n1 ) ( s 22 / n 2 ) has approximately a t-distribution. The degrees of freedom used is obtained from the sample data; it is [( s12 / n1 ) ( s 22 / n 2 )] 2 ( s12 / n1 ) 2 n1 1 ( s 22 / n2 ) 2 n2 1 rounded down to the nearest integer. The Non-Pooled t-test for two population means ASSUMPTIONS 1. 2. Independent samples Normal populations or large samples STEPS 1. 2. 3. The null hypothesis is H0 : 1 = 2 and the alternate hypothesis is one of the following: Ha : 1 2 (two-tailed) Ha : 1 < 2 (left-tailed) Ha : 1 > 2 (right-tailed) Decide on the significance level, . The critical value(s) are t/2 (two-tailed) - t (left-tailed) z (right-tailed) with df = , where [( s12 / n1 ) ( s 22 / n 2 )] 2 ( s12 / n1 ) 2 n1 1 ( s 22 / n2 ) 2 n2 1 rounded down to the nearest integer Use Table IV to find the critical value(s). 4. Compute the value of the test statistic t x1 x2 ( s12 / n1 ) ( s 22 / n 2 ) If the value of the test statistic falls in the rejection region, reject H0; otherwise, do not reject H0. State the conclusion in words. 5. 6. The non-pooled t-interval procedure for two population means ASSUMPTIONS 1. 2. Independent samples Normal populations or large samples STEPS 1. For a confidence level of 1 - , use Table IV to find t/2 with df = , where [( s12 / n1 ) ( s 22 / n 2 )] 2 ( s12 / n1 ) 2 ( s 22 / n2 ) 2 , rounded down to the nearest integer n1 1 n2 1 The endpoints of the confidence interval for 1 - 2 are 2. 2 2 ( x )t .( s / n )( s / n ) 1x 2 / 2 1 1 2 2 Choosing between a pooled and non-pooled procedure Suppose you want to compare the means of two populations using independent samples. When deciding between a pooled t-procedure and a non-pooled t-procedure, follow these guidelines: If you are reasonably sure the populations have nearly equal standard deviations, used a pooled t-procedure; otherwise, use a non-pooled t-procedure. 10.4 Inferences for two population means using paired samples The paired t-statistic Paired difference variable, d of x is the difference between the two corresponding x’s This implies that the difference between the population means is d = 1 - 2 Distribution of the paired t-statistic Suppose x is a variable on each of two populations whose members can be paired. Further suppose that the paired-difference (normal differences) variable d is normally distributed. Then, for paired samples of size n, the variable t d ( 1 2) sd / n has the t-distribution with df = n - 1 The paired t-test for two population means ASSUMPTIONS 1. 2. Paired sample Normal differences of large sample STEPS The null hypothesis is H0 : 1 = 2 and the alternate hypothesis is one of the following: Ha : 1 2 (two-tailed) Ha : 1 < 2 (left-tailed) Ha : 1 > 2 (right-tailed) Decide on the significance level, . The critical value(s) are t/2 (two-tailed) - t (left-tailed) t (right-tailed) 1. 2. 3. with df = n - 1 , where Use Table IV to find the critical value(s). d t Compute the value of the test statistic sd / n If the value of the test statistic falls in the rejection region, reject H0; otherwise, do not reject H0. State the conclusion in words. 4. 5. 6. The hypothesis test is exact when the paired-difference variable is normally distributed (normal differences) and is approximately correct for large samples when the paireddifference variable is not normally distributed (non-normal differences). The paired t-interval procedure for two population means ASSUMPTIONS 1. Paired sample 2. Normal differences or large samples STEPS 1. 2. For a confidence level of 1 - , use Table IV to find t/2 with df = n – 1. The endpoints of the confidence interval for 1 - 2 are d t /2 . sd n The confidence interval is exact when the paired-difference variable is normally distributed (normal differences) and is approximately correct for large samples when the paired-difference variable is not normally distributed (non-normal differences). What if the assumptions are not satisfied? In case you have neither normality of the paired-difference variable nor a large sample, then a nonparametric method should be used.


