1.3 Hypothesis testing
advertisement
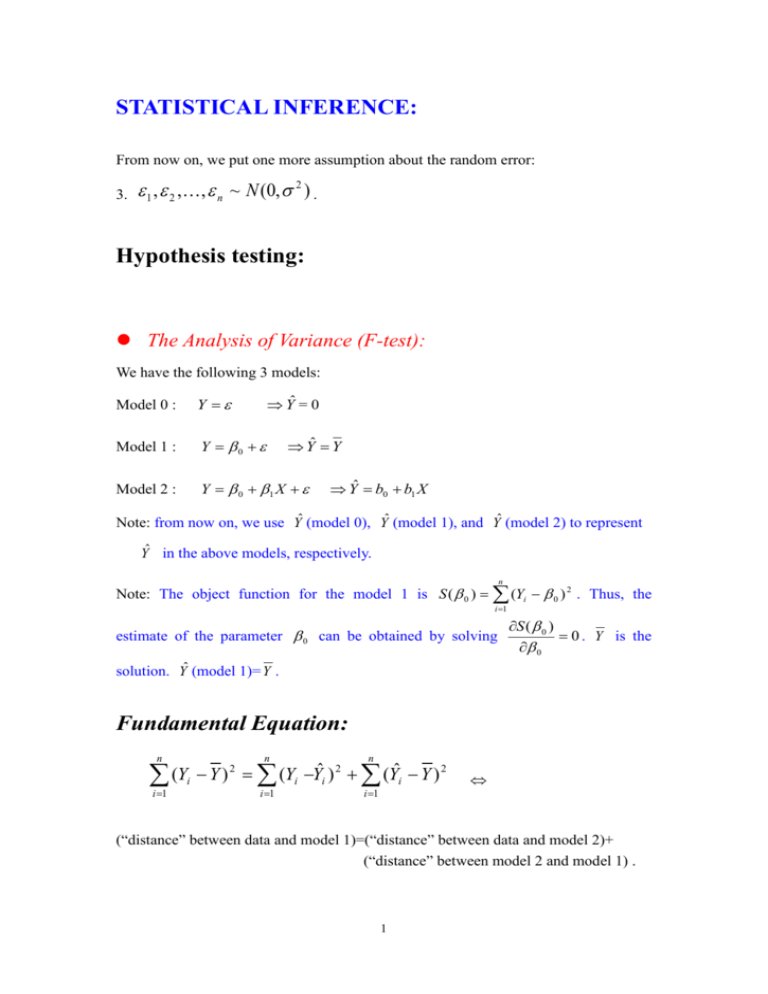
STATISTICAL INFERENCE: From now on, we put one more assumption about the random error: 3. 1 , 2 ,, n ~ N (0, 2 ) . Hypothesis testing: The Analysis of Variance (F-test): We have the following 3 models: Model 0 : Y Model 1 : Y 0 Model 2 : Y 0 1 X Ŷ = 0 Yˆ Y Yˆ b0 b1 X Note: from now on, we use Yˆ (model 0), Yˆ (model 1), and Yˆ (model 2) to represent Yˆ in the above models, respectively. n Note: The object function for the model 1 is S ( 0 ) (Yi 0 ) 2 . Thus, the i 1 estimate of the parameter 0 can be obtained by solving S ( 0 ) 0 . Y is the 0 solution. Yˆ (model 1)= Y . Fundamental Equation: n n n i 1 i 1 (Yi Y ) (Yi Yˆi ) 2 (Yˆi Y ) 2 2 i 1 (“distance” between data and model 1)=(“distance” between data and model 2)+ (“distance” between model 2 and model 1) . 1 Yˆi Y (model 1) Yi (model 2) (data) n (Yˆ Y ) n (Y 2 i i 1 i 1 n (Y i i 2 i Yˆi ) 2 Y )2 [Derivation of Fundamental Equation]: n n n n n i 1 i 1 i 1 i 1 i 1 n n i 1 i 1 (Yi Y ) 2 (Yi Yˆi Yˆi Y ) 2 (Yi Yˆi ) 2 (Yˆi Y ) 2 2 (Yi Yˆi )(Yˆi Y ) (Yi Yˆi ) 2 (Yˆi Y ) 2 since n (Y i 1 i n Yˆi )(Yˆi Y ) Yi (Y b1 ( X i X )) Y b1 ( X i X ) Y i 1 n (Yi Y ) b1 ( X i X ) b1 ( X i X ) i 1 n b1 (Yi Y ) b1 ( X i X ) ( X i X ) i 1 n n b1 (Yi Y )( X i X ) b1 ( X i X ) 2 b1 ( S XY b1 S XX ) i 1 i 1 S b1 ( S XY XY S XX ) b1 ( S XY S XY ) 0 S XX The ANOVA (Analysis of Variance) table corresponding to the fundamental equation: Source df Residual n-2 SS MS n (Yi Yˆi ) 2 i 1 n (Y i 1 i Yˆi ) 2 n2 Due to regression ( b1 | b0 ) Total (corrected) n 1 (Yˆ Y ) i 1 (Y i 1 Due to b0 1 2 i n n-1 n i Y )2 n nY (Y 0) 2 2 i 1 Total n n i 1 i 1 Yi 2 (Yi 0) 2 n 2 (Yˆ Y ) i 1 i 2 n (Yˆ Y ) Note that in addition to 3 sum of squares i 1 n (Y SYY n Y i i 1 i 1 i n 2 , i Y ) 2 , two more sum of squares nY (Y i 1 i Yˆi ) 2 and n (Y 0) 2 , and 2 i 1 n 2 (Yi 0) 2 are in the table. Since 0 is the predicted value (fitted value) in i 1 n model 0, (Y i i 1 Y ) 2 is the distance between model 1 and model 0 and n nY (Y 0) 2 is the distance between the data and model 0. 2 i 1 That is, Yˆi 0 Y (model 0) (model 1) n (Y 0) Yi (model 2) n (Yˆ Y ) 2 i 1 i 1 (data) n (Y 2 i i 1 i Yˆi ) 2 n Y i 1 n 2 i n n n i 1 i 1 i 1 (Yi 0) (Yi Yˆi ) 2 (Yˆi Y ) 2 (Y 0) 2 2 i 1 (the distance between the data and model 0) = (the distance between the data and model 2) + (the distance between model 2 and model 1) + (the distance between model 1 and model 0) Note: n (Yˆi Y ) 2 is referred to as sum of square due to regression while i 1 n (Y i 1 i Yˆi ) 2 is referred to as the residual sum of square. In the above ANOVA table, df (degrees of freedom) indicates the sum of squares consists of how many the squares of independent random variables. Heuristically, df can be thought as the number of pieces of independent information in the associated 3 sum of squares. The intuition of df is given in the following: n (a) Why would the degree of freedom of (Y Y ) 2 be n-1 ? i i 1 Y1 Y ,Y2 Y ,, Yn Y : total n components. However, n (Y i 1 i n Yn Y Y ) Yi nY 0 i 1 n 1 (Yi Y ) . i 1 The last component Yn Y is the linear combination of the first n-1 components Y1 Y , Y2 Y ,, Yn1 Y . That is, as Y1 Y , Y2 Y ,, Yn1 Y are known, Yn Y can obtained via the above equation. The piece of information obtained from Yn Y is not independent of that obtained from Y1 Y , Y2 Y ,, Yn1 Y . On the other hand, any of the first n-1 components can not be obtained even as the previous components are known. n (b) Why would the degrees of freedom of (Yˆ Y ) i 1 n n (Yˆi Y ) 2 Y b1 ( X i X ) Y i 1 i 1 n Since (X i 1 i b (X 2 n i 1 2 1 i 2 be 1 ? n i X ) 2 b12 ( X i X ) 2 . i 1 X ) 2 is a constant and b12 is a random variable, the degrees of n (Yˆ Y ) freedom of i 1 i 2 is 1. n (c) Why would the degrees of freedom of (Y i 1 n Since (Y i 1 i Y ) 2 and i Yˆi ) 2 be n-2 ? n (Yˆ Y ) i 1 i 2 are the sum of n-1 and 1 squares of random n variables, respectively, and (Yi Y ) 2 is the sum of i 1 4 n (Yi Yˆi ) 2 and i 1 n (Yˆ Y ) i 1 i 2 , n (Y i i 1 Yˆi ) 2 would be the sum of n-2 squares of random variables. F Statistic to test H 0 : 1 0 : Denote n 2 ˆ ( Y Y ) i i s2 i 1 n2 n 2 e i i 1 n2 , the mean residual sum of squares (the residual sum of square divided by n-2). As b0 and b1 are sensible estimates of 0 and 1 , e i is a good “estimate” of i since ei Yi Yˆi 0 1 X i i b0 b1 X i ( 0 b0 ) ( 1 b1 ) X i i i . Thus, n e i 1 2 i n2 n Note: (e i 1 i n e)2 n2 ( i 1 i )2 n 1 the sample variance estimate. s 2 can be used to estimate 2 . Let n (Yˆ i 1 F i Y )2 n 1 n (Yi Yˆi ) 2 i 1 (Yˆ i 1 i Y )2 s2 , n2 the ratio of the mean sum of square due to the regression and mean residual sum of square. Intuitively, large F value might imply the difference between model 2 and model 1 are relatively large to the random variation reflected by the mean residual sum of square. That is, 1 is so significant such that the difference between model 2 and model 1 are apparent. Therefore, the F value can provide important information about if H 0 : 1 0 . Next question is to ask how large value of F can be considered to be large? By the distribution theory and the 3 assumptions about the random errors i , F ~ F1,n 2 as H 0 : 1 0 is true, where F1,n 2 is the F distribution with degrees 5 of freedom 1 and n-2, respectively. T-test: T-test can be used for testing if a single parameter is significant. Recall that n Var (b0 ) 2 X i2 i 1 nS XX , Var (b1 ) 2 S XX . b0 E (b0 ) b0 0 b E (b1 ) b1 1 ~ Tn2 and 1 ~ Tn2 , s.e.(b0 ) s.e.(b0 ) s.e.(b1 ) s.e.(b1 ) to test H 0 : 0 c , Since b0 c b0 c (nS XX )1 / 2 (b0 c) t ~ Tn2 1/ 2 n , s.e(b0 ) n 2 1 / 2 2 ( X ) s i Xi i 1 i 1 s nS XX can be used as H 0 is true, where Tn 2 is the t distribution with n-2 degrees of freedom. To test H 0 : 1 c , b1 c b1 c S 1XX/ 2 (b1 c) t ~ Tn2 , s.e(b1 ) s s 1 / 2 S XX as H 0 is true. 6
