Construct a Demand tutorial using Microsoft Excel
advertisement
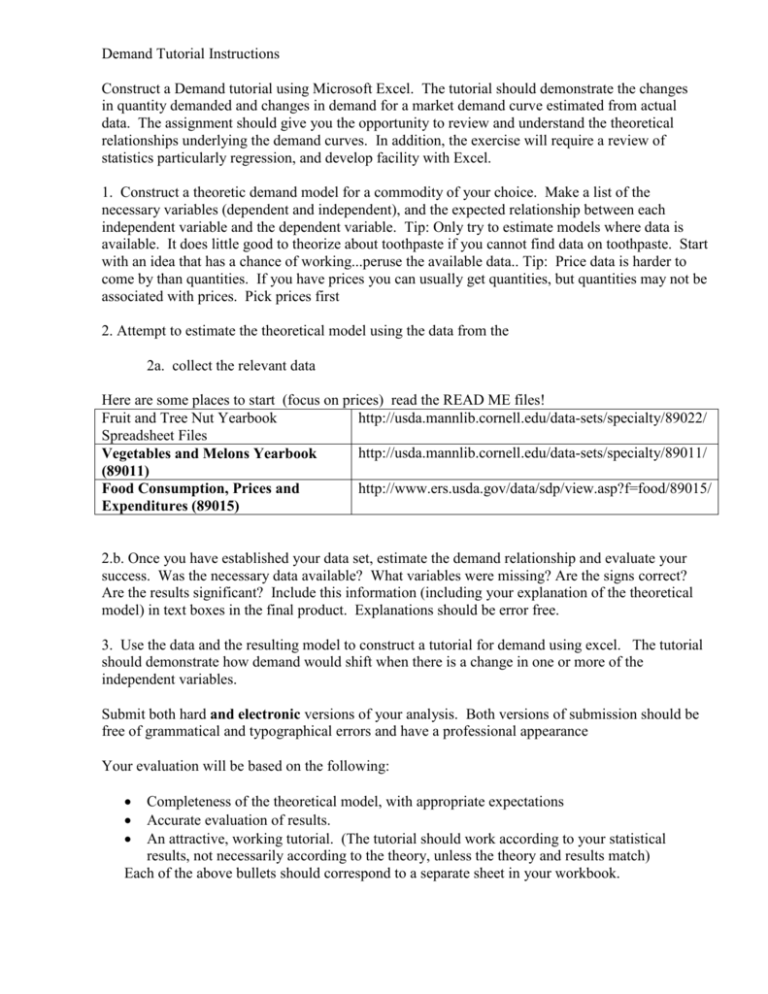
Demand Tutorial Instructions Construct a Demand tutorial using Microsoft Excel. The tutorial should demonstrate the changes in quantity demanded and changes in demand for a market demand curve estimated from actual data. The assignment should give you the opportunity to review and understand the theoretical relationships underlying the demand curves. In addition, the exercise will require a review of statistics particularly regression, and develop facility with Excel. 1. Construct a theoretic demand model for a commodity of your choice. Make a list of the necessary variables (dependent and independent), and the expected relationship between each independent variable and the dependent variable. Tip: Only try to estimate models where data is available. It does little good to theorize about toothpaste if you cannot find data on toothpaste. Start with an idea that has a chance of working...peruse the available data.. Tip: Price data is harder to come by than quantities. If you have prices you can usually get quantities, but quantities may not be associated with prices. Pick prices first 2. Attempt to estimate the theoretical model using the data from the 2a. collect the relevant data Here are some places to start (focus on prices) read the READ ME files! Fruit and Tree Nut Yearbook http://usda.mannlib.cornell.edu/data-sets/specialty/89022/ Spreadsheet Files http://usda.mannlib.cornell.edu/data-sets/specialty/89011/ Vegetables and Melons Yearbook (89011) http://www.ers.usda.gov/data/sdp/view.asp?f=food/89015/ Food Consumption, Prices and Expenditures (89015) 2.b. Once you have established your data set, estimate the demand relationship and evaluate your success. Was the necessary data available? What variables were missing? Are the signs correct? Are the results significant? Include this information (including your explanation of the theoretical model) in text boxes in the final product. Explanations should be error free. 3. Use the data and the resulting model to construct a tutorial for demand using excel. The tutorial should demonstrate how demand would shift when there is a change in one or more of the independent variables. Submit both hard and electronic versions of your analysis. Both versions of submission should be free of grammatical and typographical errors and have a professional appearance Your evaluation will be based on the following: Completeness of the theoretical model, with appropriate expectations Accurate evaluation of results. An attractive, working tutorial. (The tutorial should work according to your statistical results, not necessarily according to the theory, unless the theory and results match) Each of the above bullets should correspond to a separate sheet in your workbook. Name___________ Tutorial Evaluation rubric Component A B Theoretical All necessary Incomplete list Demand variables or description Model (dependent and of necessary independent), variables. The are adequetly expected described and relationship the expected between each relationship independent between each variable and independent the dependent variable and variable is the dependent stated and variable is supported by clearly stated standard and supported demand theory by standard demand theory Data Data collected Some readily Collection is the available appropriate to variables were the problem, not collected no obvious missing variables Model Model reflects Some Estimation the appropriate inappropriate choice of independent independent variables and dependent variables. Evaluation of Evaluation is Evaluation is regression clear and clear and identifies all identifies all problems with problems with signs and or signs but not statistical with statistical significance significance The tutorial The tutorial The tutorial functions functions does not according to according to function the model, is the model but according to attractive and is unattractive the model, and clearly shows or does not is unattractive the shifts in clearly show … the curve the curve when shifting. variables change. C Incomplete list or description of necessary variables. The expected relationship between each independent variable and the dependent variable is not clearly stated or supported by standard demand theory D F Incomplete or No Theory incorrect list of variables no theoretical relationship. Only the bare minimum requirement of variables was collected Less than the minimum number of variables was collected No data Inappropriate dependent variable Inappropriate independent and dependent variables No model Evaluation does not identify all problems with signs or statistical significance The tutorial does not function. Little evaluation of signs or significance No evaluation No tutorial

