Linear Regression Instructions TI-83
advertisement
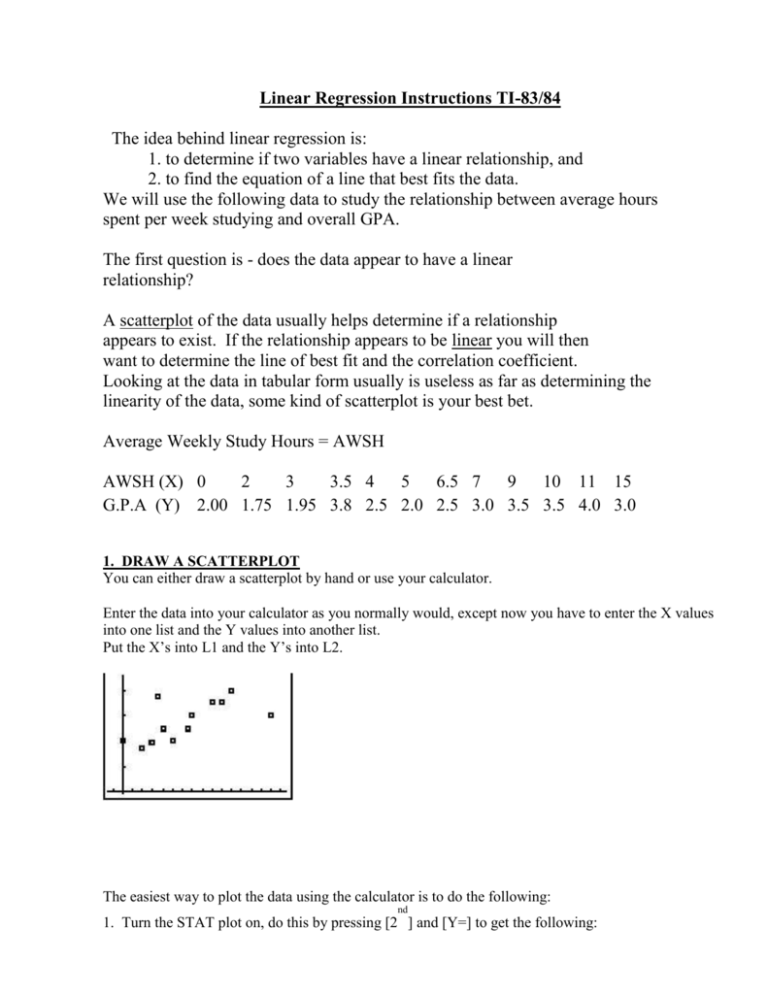
Linear Regression Instructions TI-83/84 The idea behind linear regression is: 1. to determine if two variables have a linear relationship, and 2. to find the equation of a line that best fits the data. We will use the following data to study the relationship between average hours spent per week studying and overall GPA. The first question is - does the data appear to have a linear relationship? A scatterplot of the data usually helps determine if a relationship appears to exist. If the relationship appears to be linear you will then want to determine the line of best fit and the correlation coefficient. Looking at the data in tabular form usually is useless as far as determining the linearity of the data, some kind of scatterplot is your best bet. Average Weekly Study Hours = AWSH AWSH (X) 0 2 3 3.5 4 5 6.5 7 9 10 11 15 G.P.A (Y) 2.00 1.75 1.95 3.8 2.5 2.0 2.5 3.0 3.5 3.5 4.0 3.0 1. DRAW A SCATTERPLOT You can either draw a scatterplot by hand or use your calculator. Enter the data into your calculator as you normally would, except now you have to enter the X values into one list and the Y values into another list. Put the X’s into L1 and the Y’s into L2. The easiest way to plot the data using the calculator is to do the following: nd 1. Turn the STAT plot on, do this by pressing [2 ] and [Y=] to get the following: You will need to activate the plot, activate PLOT 1 by pressing [1] or [Enter] to get First use the blue arrow keys to highlight the On choice (once the cursor in on the ON choice press [ENTER] to activate it). Second you need to pick the scatterplot choice from the list of choices, it is the first choice. Third enter the lists your x and y values are entered into (for our example this is L1 and L2) Finally press the blue [Graph] key. Note: if your graph does not appear, press the blue [ZOOM] and scroll down until you see the choice 9:ZoomStat, this will readjust the window dimensions and most likely you will see the graph now. 2. CALCULATE r (the CORRELATION COEFFICIENT) To get the summary statistics for calculating the value of r (the correlation coefficient), run the 2-var stats for x and y. 2-var stats can be found in the same menu as 1-var stats, it is the second choice, that is: Pressing [ENTER] will yield: scrolling through the list will yield We can calculate the value of r by using We can also get the calculator to calculate r for us. Under the TESTS menu (you can find this menu under the main STATS menu). Scroll down to find choice E, Pick choice E and the screen should change to Note: 1. The x and y list should correspond to the lists where you entered your data, so here it should be L1 and L2. 2. The Freq choice will usually be 1. 3. For the β & ρ : ≠0 <0 >0 row highlight the ≠0 choice. 4. Next to the RegEq we want to enter Y1, to do so, place the cursor next to the RegEq and then press [VARS], move the cursor to highlight the Y-Vars menu, the first choice should be 1:Function, press 1 or [ENTER], the new menu should yield a list of y-vars, the first choice should be 1:Y1, just press [ENTER] and you should return to the line RegEq and the Y1 should be where you want it (you should not have to do this step again unless you erase the calculator memory). The screen should now look like : Now put the cursor on the Calculate choice and press enter, you should get the following: scroll down to get the rest of the information More information is given than we need at the moment, but we will go back and use the rest, notice the value for r is the same was we calculated by hand. 3. TEST r FOR STATISTICAL SIGNIFICANCE Once r is calculated, we need to determine if r is statistically significant. If r is statistically significant then we will proceed to find the regression line (or line of best fit). There are two ways to test the significance of r. This test involves testing Ho: ρ = 0 there is no significance H1: ρ ≠ 0 there is a significant relationship Method 1 Using Table A-6 1. Find the absolute value of r 2. Determine your level of significance, either 0.05 or 0.01 3. Go to the row that corresponds to n 4. If the absolute value of your r is greater than the value from the table, your r is statistically significant, and there is a linear correlation. Method 2 Using the t-test for r. 1. Calculate t, the degrees of freedom are n-2 2. Find the t-statistic from Table A-3, row n-2 and the column that corresponds to your choice of α. 3. Determine if your test statistic falls in the rejection or acceptance region. (Notice the t value is calculated when you run the LinRegTTest as well as the p-value for the test) If r is statistically significant, we can proceed and find the line of best fit. 4. FIND REGRESSION LINE (or LINE OF BEST FIT) We have already found all the info we need to calculate the line of best fit when we found the 2-var stats. The line of best fit has the form , where = y-intercept and = slope In this case we can find that So our line of best fit is Notice the calculator calculated these values when we ran the LinRegTTest, note on the calculator b0 is the value of “a” and b1 is the value of “b”. Graph the line of best fit over the scatterplot of the data set and see that we have To get the line in your graph, just press the blue [GRAPH] key again, and the scatterplot should appear but this time the regression line should also appear (this results because you entered the Y1 next to the RegEQ in the LinRegTTest, if you had not done this the line would not appear now).


