INFERENTIAL STATISTICS
advertisement

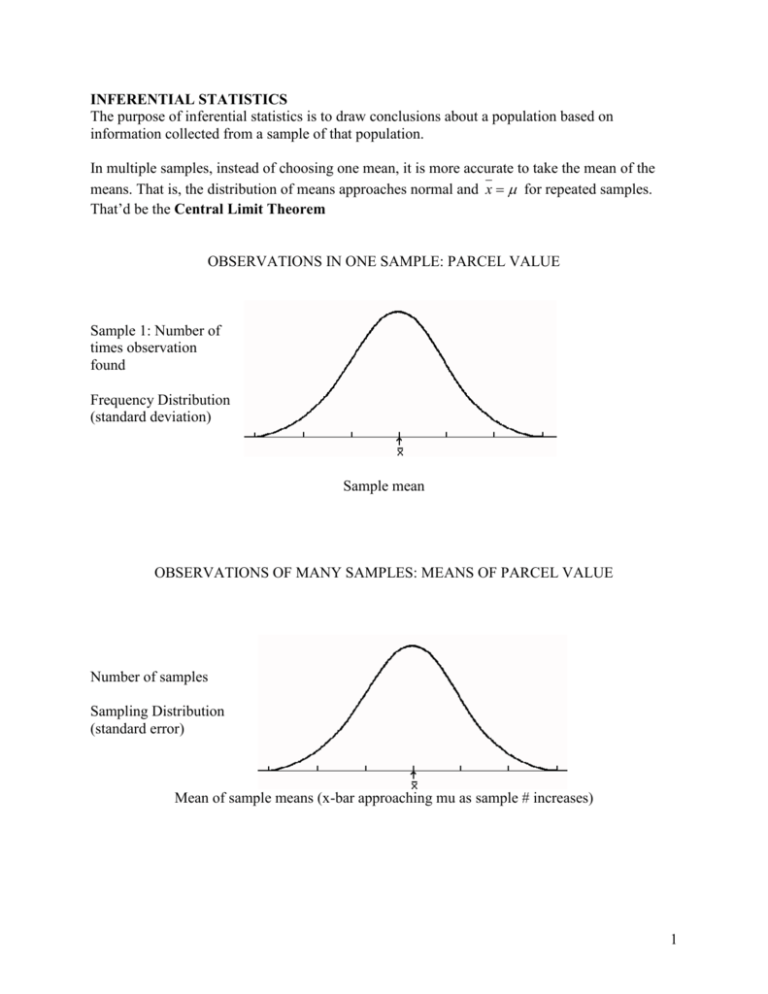
INFERENTIAL STATISTICS The purpose of inferential statistics is to draw conclusions about a population based on information collected from a sample of that population. In multiple samples, instead of choosing one mean, it is more accurate to take the mean of the means. That is, the distribution of means approaches normal and x for repeated samples. That’d be the Central Limit Theorem OBSERVATIONS IN ONE SAMPLE: PARCEL VALUE Sample 1: Number of times observation found Frequency Distribution (standard deviation) Sample mean OBSERVATIONS OF MANY SAMPLES: MEANS OF PARCEL VALUE Number of samples Sampling Distribution (standard error) Mean of sample means (x-bar approaching mu as sample # increases) 1 Inferential Statistics Estimation Hypothesis Testing •Start from a sample. A statistic is measured. •Make a hypothesis about the value of a parameter. •Generalize to population (guess the parameter) taking into account: •On that basis, predict the corresponding statistic will fall in a given range close to that value (the acceptance range) •Estimate is approximate (margin of error) and, •It could be completely wrong if sample is exceptionally different from population (probability of error) •Measure the statistic and decide if it falls within predicted range. •Draw a conclusion: if statistic is within predicted range, we accept hypothesis as probably true, if outside, we reject the hypothesis as probably false. THE LOGIC OF ESTIMATION—Proportions and Percentages We talk about margin of error, reflecting a lack of precision, and a probability of error, reflecting the risk of our estimate being wrong. Confidence Statement Example: A poll, conducted on 1075 individuals last week, showed that 37% of all adult Americans get their fair and balanced news from Fox Television news. These results are accurate up to +-5% and are reliable 95% of the time. Questions for class: Population: all adult Americans. Clearly state the population to which your statement applies. Sample: 1075 individuals from the population. Variable measured: whether Fox news was a source for news. Measured percentage (the statistic): 37% of the sample Estimated percentage (the parameter): It is thus estimated that 37% +/-4% of the population gets their news from Fox TV news. That is somewhere between 33 and 41 percent (interval estimate). The middle value, or point estimate, is 37%. Margin of error: +/- 4%. This is the degree to which the point estimate is accurate. 2 Level of confidence: 95%. This is a measure of how sure we are of our results. In this case we are saying that 95% of the time the sample we pick is representative of the population for generalization. Probability of error: the risk that the sample we picked was misleading, more different from the population than we expected. Confidence + Risk = 100%, so risk in this case is 5%. To make estimations with a high level of confidence, we need to give a wider margin of error. The Estimation of a Percentage, Calculation of Margin of Error (confidence interval): Sample size n, proportion found in sample, p: If you want results to this level of confidence: Your margin of error is defined by: 90% 95% 99% 1.64 1.96 2.58 p1 p n p1 p n p1 p n Estimation of a Mean, Calculation of Margin of Error: Example: The same poll showed that adult Americans watch an average (mean) of 7.4 hours of television each day. These results are accurate to +/-0.1 hour, and are reliable 95% of the time. Variable: hours of TV watched per day. Measured mean (statistic): 7.4 hours (7 h, 24 m) every day, on average. This was measured. Estimated mean (parameter): 7.4 hours/day, with a six-minute margin of error. Margin of error: six minutes. Interval estimate is then 7h 18m to 7h 30m. Level of confidence: 95%. Probability of error: 5%. If you want results to this level of confidence: Your margin of error is defined by: 90% 95% 99% 1.64 1.96 2.58 n n n As sample size increases, the margin of error gets smaller. Each time your sample size quadruples your margin of error decreases by half. 3 Calculating Sample Size: Derived from equations above, for 95% confidence, given a margin of error m. 1.96 * 0.5 For estimation of a percentage, size of sample n= m 2 1.96 * For estimation of a mean, size of sample n= m A sample size of n or larger will produce a margin of error equal or smaller to our stated maximum. 2 Sampling error is the difference between results obtained from the sample and the results obtained if the entire population had been interviewed. Interestingly, it is the absolute size of the sample rather than the ratio of sample size to population size, that most affects sampling error. If you don’t have a population standard error, you rely on a best estimate—the standard deviation of the sample. THE LOGIC OF HYPOTHESIS TESTING—AKA Six steps to eternal bliss 1. Clearly define the question. 2. State testable hypothesis. 3. Collect data and calculate appropriate sample statistics (such as mean, std. dev.). 4. Determine boundaries of rejection of hypothesis.(t-crit) 5. Calculate appropriate test statistic.(t-calc) 6. Make conclusion. Be able to do it in words. We will be covering five types of tests. 1. Single mean 2. Single proportion 3. Difference in two means for paired samples (same group sampled twice) 4. Difference in two means, unpaired samples 5. Difference in nominal or ordinal scale data ( 2 ) Really, is anyone reading these notes this far? Yoo-hoo. It’s the drink of champions. 4


