Problem Set 2
advertisement
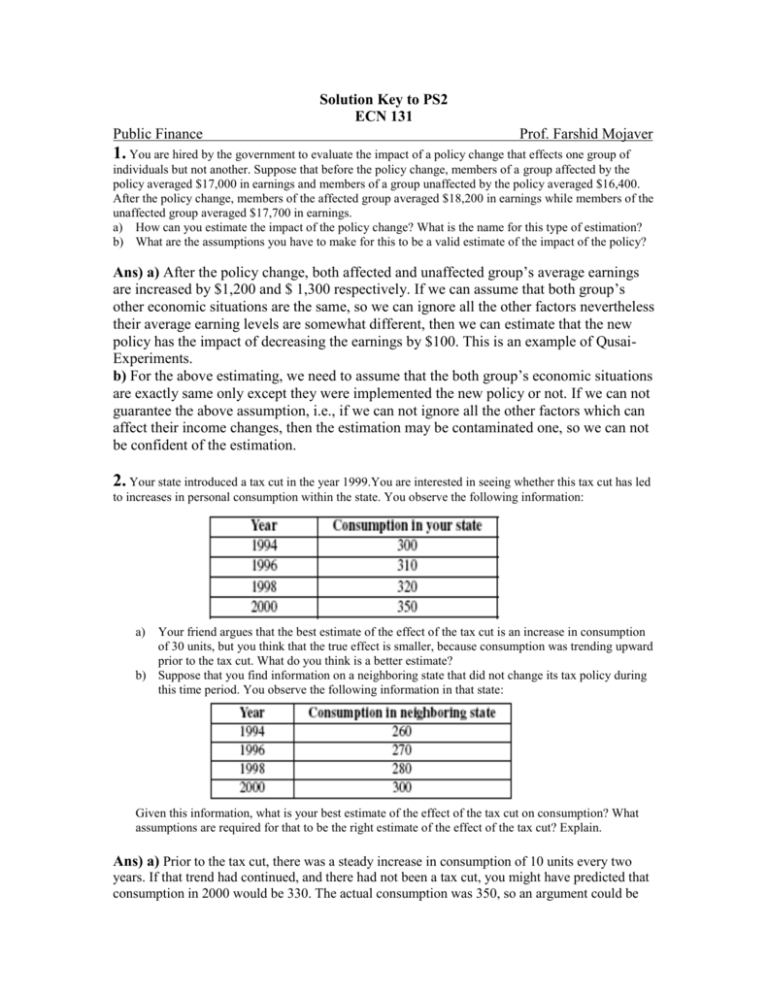
Solution Key to PS2 ECN 131 Public Finance Prof. Farshid Mojaver 1. You are hired by the government to evaluate the impact of a policy change that effects one group of individuals but not another. Suppose that before the policy change, members of a group affected by the policy averaged $17,000 in earnings and members of a group unaffected by the policy averaged $16,400. After the policy change, members of the affected group averaged $18,200 in earnings while members of the unaffected group averaged $17,700 in earnings. a) How can you estimate the impact of the policy change? What is the name for this type of estimation? b) What are the assumptions you have to make for this to be a valid estimate of the impact of the policy? Ans) a) After the policy change, both affected and unaffected group’s average earnings are increased by $1,200 and $ 1,300 respectively. If we can assume that both group’s other economic situations are the same, so we can ignore all the other factors nevertheless their average earning levels are somewhat different, then we can estimate that the new policy has the impact of decreasing the earnings by $100. This is an example of QusaiExperiments. b) For the above estimating, we need to assume that the both group’s economic situations are exactly same only except they were implemented the new policy or not. If we can not guarantee the above assumption, i.e., if we can not ignore all the other factors which can affect their income changes, then the estimation may be contaminated one, so we can not be confident of the estimation. 2. Your state introduced a tax cut in the year 1999.You are interested in seeing whether this tax cut has led to increases in personal consumption within the state. You observe the following information: a) Your friend argues that the best estimate of the effect of the tax cut is an increase in consumption of 30 units, but you think that the true effect is smaller, because consumption was trending upward prior to the tax cut. What do you think is a better estimate? b) Suppose that you find information on a neighboring state that did not change its tax policy during this time period. You observe the following information in that state: Given this information, what is your best estimate of the effect of the tax cut on consumption? What assumptions are required for that to be the right estimate of the effect of the tax cut? Explain. Ans) a) Prior to the tax cut, there was a steady increase in consumption of 10 units every two years. If that trend had continued, and there had not been a tax cut, you might have predicted that consumption in 2000 would be 330. The actual consumption was 350, so an argument could be made that the additional increase of 20 units can be attributed to the tax cut, over and above the general trend. b)This new information suggests that growth in consumption would have been greater than the past trend indicates even if there had been no tax cut. The difference in the “control” state—the state that did not change its tax policy—is 20 units, or approximately 7% ([300 – 280] ÷ 280). The difference in the treatment state is (350 – 320) ÷ 320 = 9.4%. The difference in the difference is only 2.4%, but this is a good estimate of the effect of the policy only if the states are roughly comparable in other ways. The estimate assumes that economic impacts were similar in each state (perhaps because they are neighboring and so have similar industries, urbanization, demographics, etc.) and that no other policies that might affect consumption were instituted in either state during that same period. 3. Researchers often use panel data (multiple of observations over time of the same people) to conduct regression analysis. With these data, researchers are able to compare the same person over time in assessing the impacts of policies on individual behavior. How could this provide an improvement over crosssectional analysis of the type described in the text? Ans) Panel data sets allow researchers to control for attributes of a person that do not change over time. For example, it is particularly hard to obtain data about attitudes, preferences for leisure, familial or cultural values, and the like, but these traits are likely to be fairly stable in adults. Therefore a researcher can control for these unobservable, or immeasurable, influences on behavior by using panel data. In effect, the researcher can hold the person’s underlying preferences and attitudes constant while observing their responses to policy over time. 4. Measurement using statistical methods a) How can one measure the magnitude of labor supply in response to a cut in TANF benefits using Time Series Analysis or Cross-Section Analysis? b) When are TSA and CSA most useful? c) What are the shortcomings of these two statistical methods? d) How can Panel Data Analysis help to reduce such problems? Ans) a) In both TSA and CSA we try to explain labor supply of needy families using TANF as an independent variable in a regression analysis. In TSA the regression is done over time assuming that observed changes in labor supply are caused by changes in changes in TANF. In CSA the regression is done at one point in time assuming the observed differences between people’s behavior is caused by differences in the TANF received. b) TSA is most useful when there are sharp changes in TANF. CSA is most useful when the needy families are similar to each other in terms of their relevant characteristics such as their taste for leisure. c) It is difficult to interpret TSA results as causal because so there might be so many other potential explanations available. Changes in labor supply might be correlated changes in TANF but not due to them. The problem with CSA is that the results may represent different choices made by people with different tastes, and not changes of behavior in response to changes in TANF as we would like to see. d) PDA traces labor supply responses of people with different characteristics over time. So this method acknowledges that part f the observed differences in labor supply is due to different characteristics of the recipients and can measure that. By tracing the behavior of classes of individuals PDA can measure the response of different people to changes in TANF benefits over time. This method is better than CSA and TSA but it is still subject to some of the objections that we raised against TSA. 5. Not answered. It was a question to promote discussion. We will have a longer discussion about it in the future.


