5. Estimation
advertisement

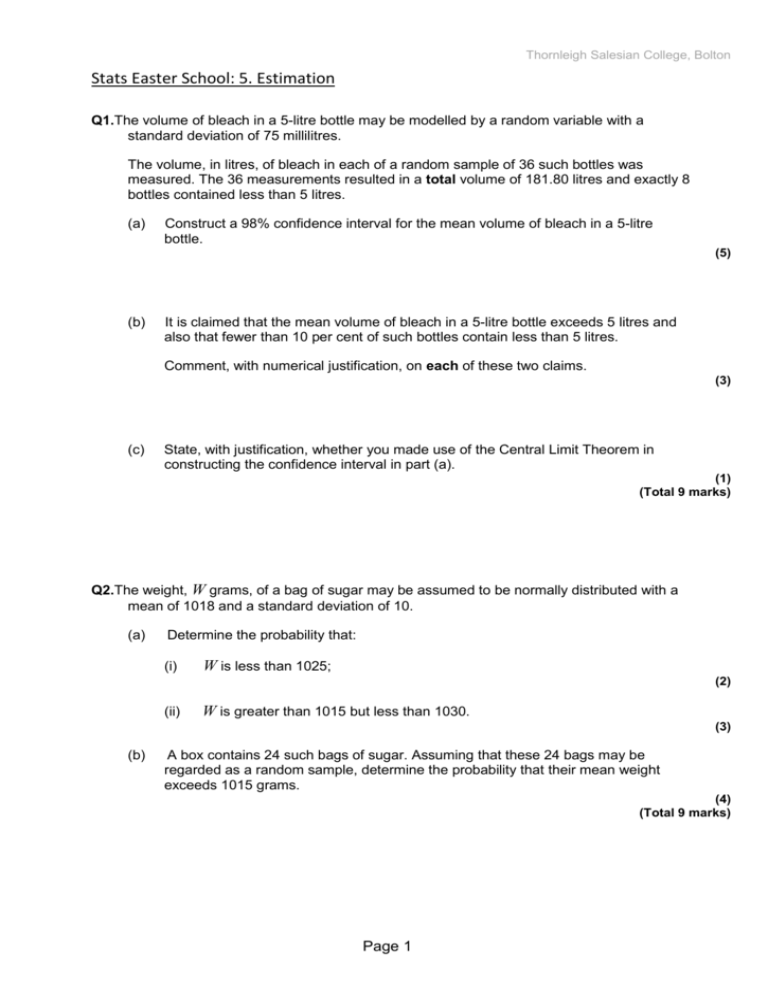
Thornleigh Salesian College, Bolton Stats Easter School: 5. Estimation Q1.The volume of bleach in a 5-litre bottle may be modelled by a random variable with a standard deviation of 75 millilitres. The volume, in litres, of bleach in each of a random sample of 36 such bottles was measured. The 36 measurements resulted in a total volume of 181.80 litres and exactly 8 bottles contained less than 5 litres. (a) Construct a 98% confidence interval for the mean volume of bleach in a 5-litre bottle. (5) (b) It is claimed that the mean volume of bleach in a 5-litre bottle exceeds 5 litres and also that fewer than 10 per cent of such bottles contain less than 5 litres. Comment, with numerical justification, on each of these two claims. (3) (c) State, with justification, whether you made use of the Central Limit Theorem in constructing the confidence interval in part (a). (1) (Total 9 marks) Q2.The weight, W grams, of a bag of sugar may be assumed to be normally distributed with a mean of 1018 and a standard deviation of 10. (a) Determine the probability that: (i) W is less than 1025; (2) (ii) W is greater than 1015 but less than 1030. (3) (b) A box contains 24 such bags of sugar. Assuming that these 24 bags may be regarded as a random sample, determine the probability that their mean weight exceeds 1015 grams. (4) (Total 9 marks) Page 1 Thornleigh Salesian College, Bolton Q3.A random sample of 50 full-time university employees was selected as part of a higher education salary survey. The annual salary in thousands of pounds, x, of each employee was recorded, with the following summarised results. ∑ x = 2290.0 and ∑ (x − x̅)2 = 28 225.50 Also recorded was the fact that 6 of the 50 salaries exceeded £60 000. (a) (i) Calculate values for x̅ and s, where s2 denotes the unbiased estimate of σ 2. (3) (ii) Hence show why the annual salary, X, of a full-time university employee is unlikely to be normally distributed. Give numerical support for your answer. (2) (b) (i) Indicate why the mean annual salary, X̅, of a random sample of 50 full-time university employees may be assumed to be normally distributed. (2) (ii) Hence construct a 99% confidence interval for the mean annual salary of full-time university employees. (4) (c) It is claimed that the annual salaries of full-time university employees have an average which exceeds £55 000 and that more than 25% of such salaries exceed £60 000. Comment on each of these two claims. (3) (Total 14 marks) Page 2 Thornleigh Salesian College, Bolton M1.(a) x̅ = 5.05 or 5050 CAO B1 98% (0.98) ⇒ z = 2.32 to 2.33 AWFW (2.3263) B1 CI for μ is Used with z (2.05 to 2.58), x̅ (5.05, 5050 or 181.8), σ (0.0075, 0.075, 0.75, 7.5 or 75) and ÷ with n > 1 M1 Thus 5.05 ≠ 2.3263 × z (2.05 to 2.06 or 2.32 to 2.33 or 2.57 to 2.58), x̅ (5.05) & σ (0.075) or x̅ (5050) & σ (75) and ÷ A1 Hence 5.05 ± 0.03 or 5050 ± 30 OR (5.02, 5.08) or (5020, 5080) CAO / AWRT Dependent on previous A1 so can be scored with z ≠ 2.32 to 2.33 Page 3 Thornleigh Salesian College, Bolton Ignore (absence of) quoted units AWRT to 3sf accuracy Adep1 5 Note (b) Use of t(2.43 to 2.72) ⇒ B1 B0 M1 A0 A0 max Clear correct comparison of 5 or 5000 with LCL or CI so agree with (first) claim (about mean) Dependent on Adep1 in (a) Must use consistent units Adep1 (8 / 36 or 0.22 or 22%) v (1 / 10 or 0.10 or 10%) or 8 v 3.6 (3 to 4) Mention of a value on LHS and a value on RHS B1 so 8 / 36 OE >/≠ 1 / 10 OE so disagree with (second) claim (about individuals) Dependent on B1 Explicit comparison of values and correct conclusion Bdep1 3 Notes 1 It / (claimed) mean / (claimed) value < LCL / CI ⇒ Adep0 Must indicate 5 or 5000 2 98% have (mean) weights between CLs so … ⇒ Adep0 3 Any reference to CI for second claim ⇒ B0 Bdep0 Claim refers to individual bottles (c) Yes because volumes / bleach / litres / bottles / (parent) population are not (stated as) normally distributed OE; but do not accept ‘data’ or ‘sample’ or ‘it’ Page 4 Thornleigh Salesian College, Bolton Reference to sample size only ⇒ B0 (eg n > 25 or n > 30) B1 1 [9] M2.(a) Weight, W ̴ N (1018, 102) (i) P(W < 1025) = Standardising (1024.5, 1025 or 1025.5) with 1018 and (√10, 10 or 102) and / or (1018 – x) May be gained in (a)(i) or (a)(ii) M1 P(Z < 0.7) = 0.758 AWRT (0.75804) A1 2 (ii) P(1015 < W < 1030) = P (W < 1030) – P(W < 1015) = P(Z < 1.2) – P(Z < –0.3) Difference of two probabilities May be implied M1 = 0.88493 – (1 – 0.61791) Area change May be implied by answer M1 = 0.502 to 0.504 AWFW (0.50284) A1 3 (b) ̴ Normal with μ = 1018 and Page 5 Thornleigh Salesian College, Bolton to 4.2 CAO/AWFW (4.16666) B1 or to 2.05 CAO/AWFW (2.04124) Standardising 1015 with 1018 and c’s ; not σ M1 = P (Z > –1.47) = 1 – P(Z <1.47) Area change May be implied by answer > 0.5 m1 = 0.927 to 0.932 AWFW (0.92918) A1 4 [9] M3.(a) (i) x̅ = = 45.8 or 45800 CAO B1 Page 6 Thornleigh Salesian College, Bolton (s2 =) or (s =) Ignore notation M1 s = 24(.0) or 24000 to 24001 AWRT / AWFW (σ = 23.75942) (24.00064) SCs: (for no seen working) M1 A1 for 24.0 or 24000 to 24001 M1 A0 for 24 or 23700 to 23800 A1 3 (ii) x̅ − ns = (45.8 − n × 24.0) SC: Accept quoted values of (−4 to −1) (n = 2) or (−28.5 to −23.5) (n = 3) (both AWFW) Allow (45 to 47) and any multiple of (23.5 to 24.5) which gives value < 0 Must clearly state the value of a numerical expression M1 and negative salaries are impossible OE; must be in context Negative values impossible ⇒ A0 A1 2 Alternative solution 1 P(X 2) = P(Z < −1.91) Standardising 0 using 45.8 & 24.0 Page 7 Thornleigh Salesian College, Bolton (M1) = 0.027 to 0.03 In addition to probability within range, must state that negative salaries are impossible (A1) (2) Alternative solution 2 P(X > 60 | N(45.8, 24.02)) = P(Z > 0.59) Standardising 60 using 45.8 & 24.0 (M1) = 0.27 to 0.28 In addition to probability within range, must compare calculated value to 6 / 50 = 0.12 OE (A1) (2) (b) (i) Large sample or n > 25 or 30 or n = 50 OE B1 so CLT applies Must indicate CLT; dependent on B1 Indication that other than sample mean is normally distributed ⇒ Bdep0 Bdep1 2 (ii) 99% (0.99) ⇒ z = 2.57 to 2.58 Page 8 Thornleigh Salesian College, Bolton AWFW (2.5758) B1 CI for μ is x̅ ± z × Used with (x̅ & s) from (a)(i) and z(1.64 to 2.58) & ÷ with n > 1 M1 Thus 45.8 ± 2.5758 × F on (x̅ & s) with ÷ & z(1.64 to 1.65 or 2.32 to 2.33 or 2.57 to 2.58) AF1 Hence 45.8 ± (8.7 to 8.8) or 45800 ± (8700 to 8800) OR (37.(0) to 37.1, 54.5 to 54.6) or (37000 to 37100, 54500 to 54600) CAO / AWFW (8.74) Ignore (absence of) quoted units AWFW A1 4 (c) See supplementary sheet for additional illustrations Clear correct comparison of 55 or 55000 with c’s UCL or CI Accept 55000 compared with c’s 54.5 to 54.6 (ie different units) B1 (6/50 or 0.12 or 12%) </≠ 0.25 or 25% OE; correct comparison mentioning both 12% and 25% Page 9 Thornleigh Salesian College, Bolton B1 Reject both / each of the two claims Dependent on B1 B1 Bdep1 3 Additional comment illustrations It / (claimed) mean / (claimed) value > UCL / CI Must indicate 55 or 55000 (B0) 99% have (mean) weights between CLs so... (B0) Any comparison of 60 (£60 000) with UCL / IC Value of 60 does not refer to mean (B0) P(X < 60 | N(45.8, 24.02)) = P(Z > 0.59) = (0.27 to 0.28) < 6 / 50 = 0.12 Assumes salaries ~ N; cf (a)(ii) (B0) [14] Page 10 Thornleigh Salesian College, Bolton E1.The better students generally scored full marks in part (a) usually by working in litres. However, far too many students provided answers that ranged from worthless to scoring at most 3 marks. Errors seen in abundance were: • an incorrect evaluation of • the use of 5, 181.80 or even ; this despite the use of a calculator; instead of 5.05; • the use of 75 or 0.75 instead of 0.075; • an incorrect z–value; • the omission of the divisor of . Many of these errors resulted in absurd confidence intervals that students appeared to simply accept as correct. The one mark for answering the first claim in part (b) was only available to those better students who had obtained a correct confidence interval in part (a)(ii). Even so, many such students made no comparison using the stated mean of 5 litres but merely commented that their calculated mean of 5.05 was greater than 5. This was very disappointing particularly given similar requests on previous papers. In answering the second claim in part (b), many students again referred to their confidence interval and so scored no marks. Of those that correctly evaluated as 22%, far too many were not sufficiently explicit in comparing this with 10% and so scored only 1 of the 2 marks available. It was extremely rare to see an answer worthy of the mark in part (c). Most students made reference to sample size although some suggested that the question had stated that volume was normally distributed! The minority who had some idea of what was required were almost always not sufficiently precise or careful enough in their answers. Thus it was common to read references to ‘the sample’, ‘the data’ or ‘it’ rather than for example ‘the (parent) population’ or ‘volume (of bleach)’. E2.Most candidates achieved the 5 marks available in part (a) but very few were able to make significant progress in part (b). This was disappointing, particularly as the distribution of the sample mean has been examined on several previous papers. Almost all candidates knew how to standardise – without introducing an unnecessary continuity correction, which was penalised – and so the majority completed part (a)(i) accurately. In part (a)(ii), the majority of candidates realised that a difference of two areas was required, with many obtaining the correct answer. Failure to apply the necessary area change for P (Z < − 0.3) was by far the most common error. The majority of candidates simply worked with the distribution of W, rather than , and so scored no marks. Candidates who worked with the distribution of , and so obtained correctly P (Z > − 147), sometimes then failed to make the correct area change and so lost 2 marks. Page 11 Thornleigh Salesian College, Bolton E3.Most candidates found much of this question very challenging. In part (a)(i), it was most disappointing to see the number of candidates failing to score 3 marks. Whilst there was some excuse for candidates dividing ∑ (x – x̅)2 by 50, rather than 49, there was really no excuse for the many who did not know that x̅ = . Frequent incorrect attempts included trying to substitute ∑ x into ∑(x – x̅)2 or dividing ∑ x by a variety of denominators. Some candidates were confused, either at the outset or later, by the units involved with invalid multiplications of s2 by 1000 taking place at some point. In part (a)(ii), the common incorrect answers were verbose about university salaries or simply that 24.0 was too large when compared to 45.8. Even those candidates who calculated, for example (45.8 – 2 × 24.0), simply stated that a normal distribution or ‘it’, instead of salaries, could not take negative values. Answers to part (b)(i) were slightly better with candidates indicating a ‘large sample’ so ‘Central Limit Theorem applied’. Some candidates lost both marks for ‘if sample is large’ whilst others lost a mark for suggesting that other than the sample mean could be assumed to be normally distributed. There were many partially correct answers to part (b)(ii) using follow-through answers from part (a)(i) though some candidates lost further marks for an incorrect z-value. In answering part (c), a majority of candidates attempted the comparison of 55 with their CI or UCL. However, far too many then did the same with 60 rather than compare = 12% with 25%, or considered the standardising of 60 using a normal distribution. This perhaps suggested that they had not read the question with sufficient care. Page 12


