Mean & Standard Deviation of a Discrete Probability Distribution:
advertisement

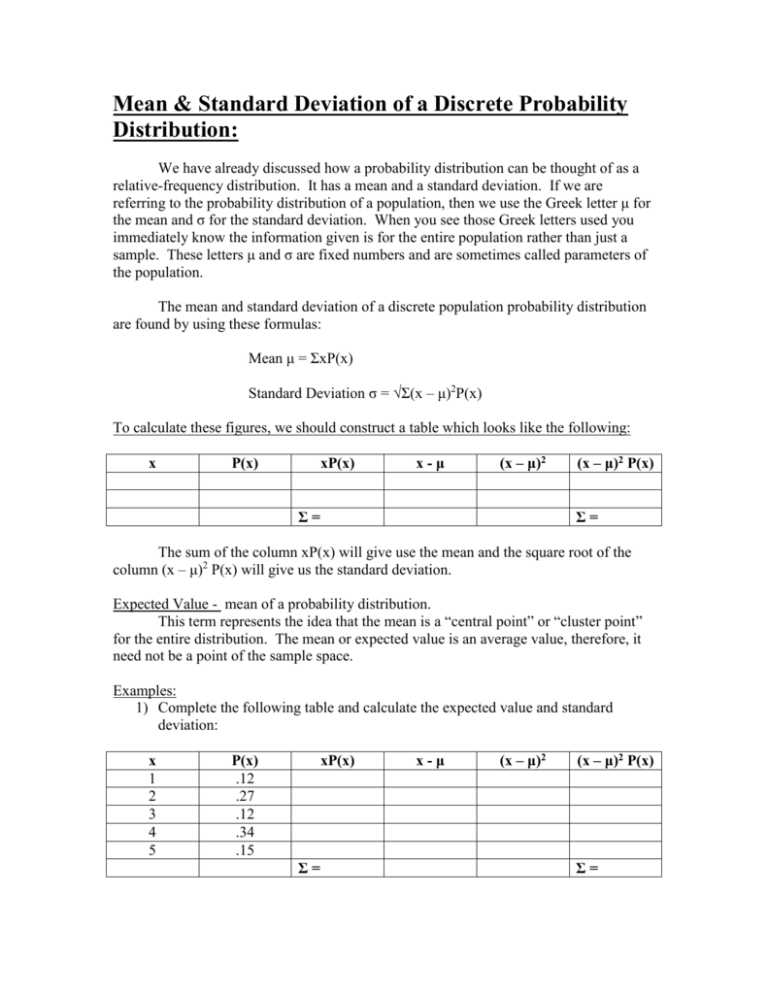
Mean & Standard Deviation of a Discrete Probability Distribution: We have already discussed how a probability distribution can be thought of as a relative-frequency distribution. It has a mean and a standard deviation. If we are referring to the probability distribution of a population, then we use the Greek letter μ for the mean and σ for the standard deviation. When you see those Greek letters used you immediately know the information given is for the entire population rather than just a sample. These letters μ and σ are fixed numbers and are sometimes called parameters of the population. The mean and standard deviation of a discrete population probability distribution are found by using these formulas: Mean μ = ΣxP(x) Standard Deviation σ = √Σ(x – μ)2P(x) To calculate these figures, we should construct a table which looks like the following: x P(x) xP(x) x-μ (x – μ)2 Σ= (x – μ)2 P(x) Σ= The sum of the column xP(x) will give use the mean and the square root of the column (x – μ)2 P(x) will give us the standard deviation. Expected Value - mean of a probability distribution. This term represents the idea that the mean is a “central point” or “cluster point” for the entire distribution. The mean or expected value is an average value, therefore, it need not be a point of the sample space. Examples: 1) Complete the following table and calculate the expected value and standard deviation: x 1 2 3 4 5 P(x) .12 .27 .12 .34 .15 xP(x) Σ= x-μ (x – μ)2 (x – μ)2 P(x) Σ= 2) Complete the following table and calculate the expected value and standard deviation: x 10 15 20 25 30 P(x) .17 .08 .16 .39 .20 x-μ xP(x) (x – μ)2 Σ= (x – μ)2 P(x) Σ= 3) A commuter must pass through five traffic lights on her way to work, and will have to stop at each one that is red. She estimates the probability model for the number of red lights she hits as shown below. x = # of red lights P(x) 0 1 2 3 4 5 .05 .25 .35 .15 .15 .05 a) Construct a table to display the data use the columns from above. b) How many red lights should she expect to hit each day. c) What’s the standard deviation? 4) To estimate the number of books required per course, the student council at Bookworth College took a random sample of 00 courses and obtained the information in the table below: x (# of Required Books) 0 1 2 3 4 5 6 f (No. of Courses) 5 48 22 11 9 3 2 a) Make a table and graph the probability distribution. b) What is the expected value of books required per course? c) If the average book costs $25 and you take five new courses, how much can you expect to pay for books? d) What’s the standard deviation? 5) A local taxi company is interested in the number of pieces of luggage a cab carries on a taxi run. A random sample of 260 taxi runs gave the following information where x = number of pieces of luggage and f = frequency which taxi runs carried this many pieces of luggage: x f 0 42 1 51 2 63 3 38 4 19 5 16 6 12 7 10 8 6 9 3 a) If a taxi run is chosen at random from these 260 runs, use relative frequencies to find P(x) for x = 0,1,2,3,4,5,6,7,8, and 9. b) Use a histogram to graph the probability distribution of part a. c) Assuming these 260 taxi runs represent the population of all taxi runs in this area, what do you estimate the probability is that a randomly selected taxi run will have from 0 to 4 pieces of luggage (including 0 and 4)? d) What do you estimate the probability is that a randomly selected taxi run will have from 6 – 10 pieces of luggage (including 6 and 10)? e) Compute the expected value of the distribution. f) Compute the standard deviation of the distribution.


