Acute kidney injury and 30-day mortality in patients undergoing
advertisement
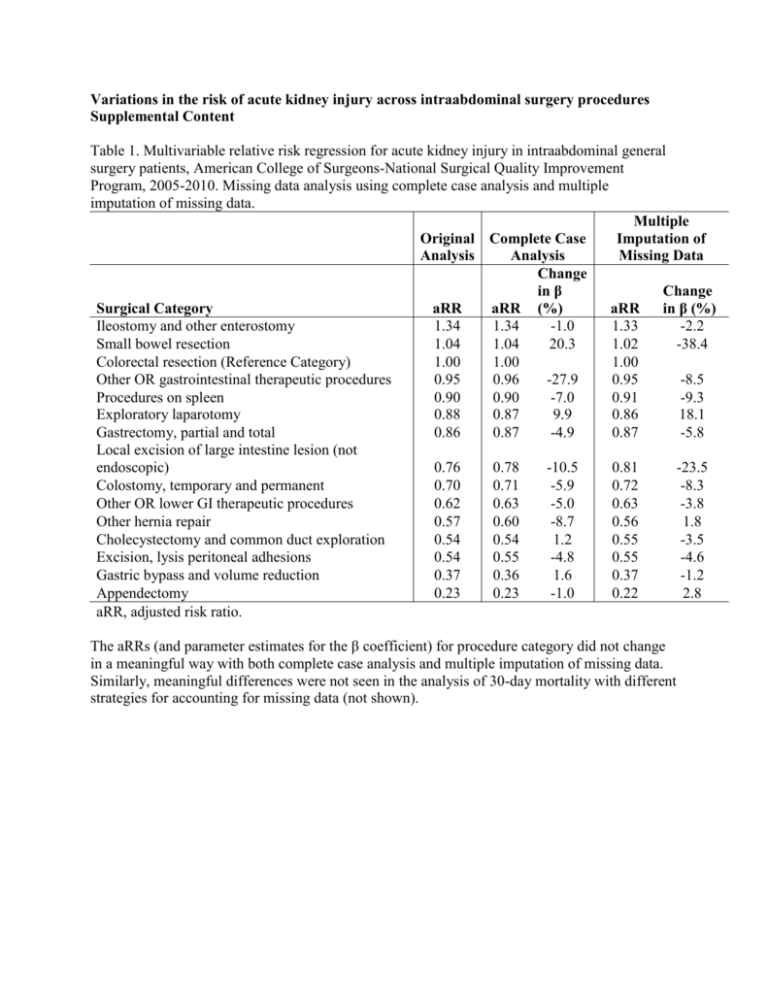
Variations in the risk of acute kidney injury across intraabdominal surgery procedures Supplemental Content Table 1. Multivariable relative risk regression for acute kidney injury in intraabdominal general surgery patients, American College of Surgeons-National Surgical Quality Improvement Program, 2005-2010. Missing data analysis using complete case analysis and multiple imputation of missing data. Multiple Original Complete Case Imputation of Analysis Analysis Missing Data Change in β Change Surgical Category aRR aRR (%) aRR in β (%) Ileostomy and other enterostomy 1.34 1.34 -1.0 1.33 -2.2 Small bowel resection 1.04 1.04 20.3 1.02 -38.4 Colorectal resection (Reference Category) 1.00 1.00 1.00 Other OR gastrointestinal therapeutic procedures 0.95 0.96 -27.9 0.95 -8.5 Procedures on spleen 0.90 0.90 -7.0 0.91 -9.3 Exploratory laparotomy 0.88 0.87 9.9 0.86 18.1 Gastrectomy, partial and total 0.86 0.87 -4.9 0.87 -5.8 Local excision of large intestine lesion (not endoscopic) 0.76 0.78 -10.5 0.81 -23.5 Colostomy, temporary and permanent 0.70 0.71 -5.9 0.72 -8.3 Other OR lower GI therapeutic procedures 0.62 0.63 -5.0 0.63 -3.8 Other hernia repair 0.57 0.60 -8.7 0.56 1.8 Cholecystectomy and common duct exploration 0.54 0.54 1.2 0.55 -3.5 Excision, lysis peritoneal adhesions 0.54 0.55 -4.8 0.55 -4.6 Gastric bypass and volume reduction 0.37 0.36 1.6 0.37 -1.2 Appendectomy 0.23 0.23 -1.0 0.22 2.8 aRR, adjusted risk ratio. The aRRs (and parameter estimates for the β coefficient) for procedure category did not change in a meaningful way with both complete case analysis and multiple imputation of missing data. Similarly, meaningful differences were not seen in the analysis of 30-day mortality with different strategies for accounting for missing data (not shown). Table 2. Multivariable relative risk regression for acute kidney injury in intraabdominal general surgery patients, American College of Surgeons-National Surgical Quality Improvement Program, 2005-2010. Analysis with CPT in lieu of CCS category. aRR Original using Change Variable aRR CPT in β (%) Age (years) 1.007 1.007 4.9 Female 0.54 0.55 -1.9 White Race 0.73 0.73 0.7 Laparoscopic 0.52 Body Mass Index (Ref = <29) BMI 29-39 1.26 1.27 0.8 BMI >39 1.97 1.97 0.3 Emergency 1.16 1.20 19.9 Functionally Dependent 1.49 1.50 0.4 Dyspneic 1.23 1.23 -1.5 Ventilator Dependent 1.42 1.38 -8.9 Chronic Obstructive Pulmonary Disease 1.11 1.12 5.8 Current Smoker 1.15 1.15 0.3 Diabetic 1.28 1.27 -2.9 Congestive Heart Failure 1.22 1.23 2.2 Myocardial Infarction 1.30 1.29 -4.1 Hypertension 1.50 1.51 0.3 Bleeding disorders 1.27 1.28 0.5 Ascites 1.50 1.52 3.8 eGFR (ml/min/1.73m2) (Ref = >90) <15 7.80 7.91 0.7 15-30 5.10 5.11 0.1 30-60 2.54 2.55 0.4 60-90 1.24 1.23 -2.7 Missing 0.97 0.99 -79.2 Hematocrit (Ref = Normal 34-44) Low ≤34 1.41 1.44 6.4 High >44 0.95 0.94 7.9 Missing 1.37 1.39 6.0 Cancer 1.31 1.19 -34.4 Chronic Steroid Use 1.19 1.15 -17.0 Preoperative SIRS/Sepsis/Septic Shock 1.52 1.56 7.3 aRR, adjusted risk ratio. The aRRs and parameter estimates for the other independent variables were comparable whether we incorporated the CCS category or the individual CPT codes. Similarly, the use of CPT codes instead of CCS categories did not lead to any meaningful changes in our analysis of 30-day mortality (not shown). 1
