Supplementary Information (doc 753K)
advertisement
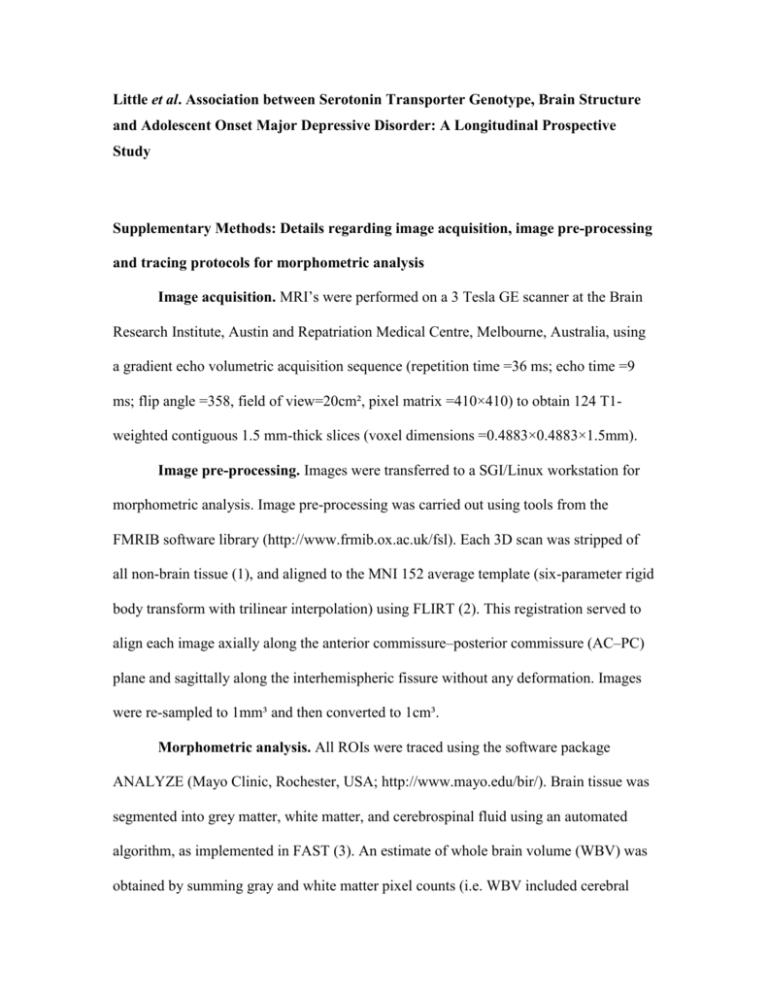
Little et al. Association between Serotonin Transporter Genotype, Brain Structure and Adolescent Onset Major Depressive Disorder: A Longitudinal Prospective Study Supplementary Methods: Details regarding image acquisition, image pre-processing and tracing protocols for morphometric analysis Image acquisition. MRI’s were performed on a 3 Tesla GE scanner at the Brain Research Institute, Austin and Repatriation Medical Centre, Melbourne, Australia, using a gradient echo volumetric acquisition sequence (repetition time =36 ms; echo time =9 ms; flip angle =358, field of view=20cm², pixel matrix =410×410) to obtain 124 T1weighted contiguous 1.5 mm-thick slices (voxel dimensions =0.4883×0.4883×1.5mm). Image pre-processing. Images were transferred to a SGI/Linux workstation for morphometric analysis. Image pre-processing was carried out using tools from the FMRIB software library (http://www.frmib.ox.ac.uk/fsl). Each 3D scan was stripped of all non-brain tissue (1), and aligned to the MNI 152 average template (six-parameter rigid body transform with trilinear interpolation) using FLIRT (2). This registration served to align each image axially along the anterior commissure–posterior commissure (AC–PC) plane and sagittally along the interhemispheric fissure without any deformation. Images were re-sampled to 1mm³ and then converted to 1cm³. Morphometric analysis. All ROIs were traced using the software package ANALYZE (Mayo Clinic, Rochester, USA; http://www.mayo.edu/bir/). Brain tissue was segmented into grey matter, white matter, and cerebrospinal fluid using an automated algorithm, as implemented in FAST (3). An estimate of whole brain volume (WBV) was obtained by summing gray and white matter pixel counts (i.e. WBV included cerebral gray and white matter, the cerebellum and brainstem, but not the ventricles, cisterns or cerebrospinal fluid). OFC and ACC estimates were based on gray matter pixel counts contained within the defined ROIs, whilst amygdala and hippocampal estimates were based on total voxels within the defined ROI (described below). The guidelines for tracing the amygdala and hippocampus were adapted from those described by Velakoulis and colleagues (4, 5). Adaptations, designed to maximize reliability, relate to marking the anterior boundary of the amygdala and the boundary between the amygdala and hippocampus. The amygdala and hippocampus were separated according to Watson et al.’s (6) protocol (see Supplementary Figure 1). Supplementary Figure 1. Example of manual delineation of bilateral amygdalae (light blue) and hippocampi (purple) on a coronal MR image. Hippocampal tracings comprised the hippocampus proper, the dendate gyrus, the subiculum, and part of the fimbria and alveus. The posterior border was defined as the section with the greatest length of continuous fornix. The lateral boundary was marked by the temporal horn of the lateral ventricle. The medial boundary was classified by the open end of the hippocampal fissure posteriorly, and by the uncal fissure anteriorly. The superior boundary was defined posteriorly by the fimbria and alveus (which were included in the tracing), and anteriorly by the amygdala. The posterior boundary of the amygdala was classified according to the first appearance of amygdala gray matter above the temporal horn. The lateral border was marked superiorly by the thin strip of white matter separating the amygdala from the claustrum and tail of the caudate, and inferiorly by the temporal stem and extension of the temporal horn. The medial border was marked superiorly by the semilunar gyrus, and inferiorly by subamygdaloid white matter, which separates the amygdala from the entorhinal cortex. The anterior boundary was identified by the joining of the optic chiasm or the point where the lateral sulcus closes to form the endorhinal sulcus (whichever was more posterior). The boundaries of the OFC were defined according to a previously published method by Riffkin et al. (7). A line through the AC-PC was drawn to define the superior boundary of the OFC. The posterior border was marked by a coronal plane passing through the most posterior aspect of the olfactory sulcus in each hemisphere. All images were manually edited to eliminate subcortical tissue and artifacts related to the eye sockets and nasal bones. In accordance with Bartholomeusz et al. (8), medial and lateral OFC regions were divided by the first prominent sulcus lateral to the olfactory sulcus (which in most cases is the medial orbital sulcus) (9). This sulcus was first identified and marked in the coronal plane, with subsequent editing conducted in the transverse plane. Supplementary Figure 2. Example of manual delineation of the orbitofrontal cortex (OFC) on an axial MR image. The right lateral and right medial regions are highlighted in dark blue and pink, respectively (forming the right OFC), whereas the left lateral and left medial regions are highlighted in yellow and green, respectively (forming the left OFC). The boundaries of the ACC were based on a previously published method (10), which defines separate limbic and paralimbic regions according to individual differences in the morphology of the cingulate, paracingulate and superior rostral sulci. Briefly, the limbic ACC contained all gray matter in the gyrus bound by the callosal sulcus and the cingulate sulcus. The paralimbic ACC contained all gray matter in the gyrus bound by the cingulate sulcus and paracingulate sulcus, except in cases where the paracingulate sulcus was absent, for which the paralimbic ACC contained only the gray matter on the upper bank of the cingulate sulcus. Supplementary Figure 3. Example of manual delineation of limbic (dark blue) and paralimbic (light blue) divisions, as a function of sulcal variability in the anterior cingulate cortex, on a sagittal MR image. Interrater and intrarater reliabilities were assessed by means of the intraclass correlation coefficient (absolute agreement) using 10 brain images from a separate magnetic resonance imaging database established for this purpose. Intraclass correlation coefficient values were deemed acceptable for all ROIs (29 of 36 the ROIs were <0.90 and none<0.75). All brain structural measures were corrected for whole-brain size separately by gender by means of a covariance adjustment method (11) and converted from mm³ to cm³. References 1. Smith SM (2002): Fast robust automated brain extraction. Hum Brain Mapp. 17:143-155. 2. Jenkinson M, Smith SM (2001): A global optimisation method for robust affine registration of brain images. Med Image Analysis. 5:143-156. 3. Zhang Y, Brady M, Smith S (2001): Segmentation of brain MR images through a hidden Markov random field model and the expectation maximization algorithm. IEEE Trans Med Imaging. 20:45-57. 4. Velakoulis D, Pantelis C, McGorry PD, Dudgeon P, Brewer W, Cook M, et al. (1999): Hippocampal volume in first-episode psychoses and chronic schizophrenia: a high-resolution magnetic resonance imaging study. Arch Gen Psychiatry. 56:133-141. 5. Velakoulis D, Wood SJ, Wong MTH, McGorry PD, Yung A, Phillips L, et al. (2006): Hippocampal and amygdala volumes according to psychosis stage and diagnosis: amagnetic resonance imaging study of chronic schizophrenia, first-episode psychosis, and ultra-high-risk individuals. Arch Gen Psychiatry. 63:139-149. 6. Watson C, Andermann F, Gloor P, Jones-Gotman M, Peters T, Evans A, et al. (1992): Anatomic basis of amygdaloid and hippocampal volume measurement by magnetic-resonance-imaging. Neurology. 42:1743-1750. 7. Riffkin J, Yücel M, Maruff P, Wood SJ, Soulsby B, Olver J, et al. (2005): A manual and automated MRI study of anterior cingulate and orbitofrontal cortices, and caudate nucleus in obsessive-compulsive disorder: Comparison with health controls and patients with schizophrenia. Psychiatry Res. 138:99 -113. 8. Bartholomeusz CF, Whittle S, McGorry P, Velakoulis D, Pantelis C, Wood SJ (2010): Orbitofrontal cortex sulcogyral patterns in first episode schizophrenia: Preliminary findings. Schizophr Res. 117:222-223. 9. Chiavaras MM, Petrides M (2000): Orbitofrontal sulci of the human and macaque monkey brain. J Comp Neurol. 422:35-54. 10. Fornito A, Yücel M, Wood SJ, Proffitt T, McGorry PD, Velakoulis D, et al. (2006): Morphology of the paracingulate sulcus and executive cognition in schizophrenia. Schizophr Res. 88:192-197. 11. Free SL, Bergin PS, Fish DR, Cook MJ, Shorvon SD, Stevens JM (1995): Methods for normalization of hippocampal volumes measured with MR. Am J Neuroradiol. 16:637-643.
