Analyze and Report Data – Response Sheet
advertisement
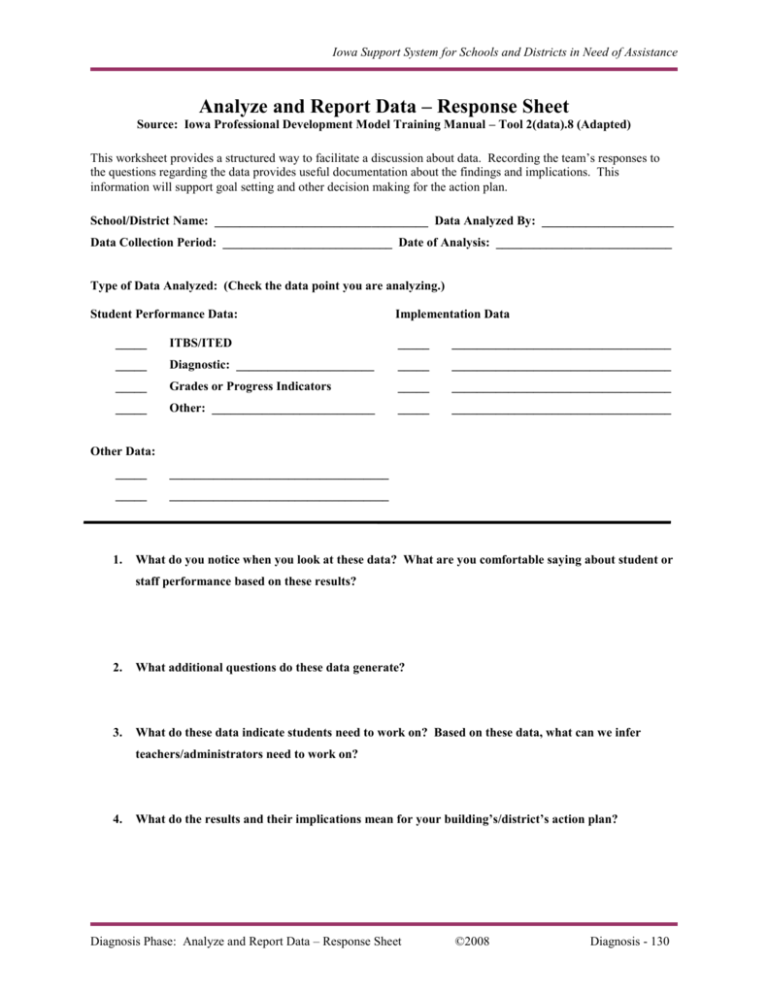
Iowa Support System for Schools and Districts in Need of Assistance Analyze and Report Data – Response Sheet Source: Iowa Professional Development Model Training Manual – Tool 2(data).8 (Adapted) This worksheet provides a structured way to facilitate a discussion about data. Recording the team’s responses to the questions regarding the data provides useful documentation about the findings and implications. This information will support goal setting and other decision making for the action plan. School/District Name: __________________________________ Data Analyzed By: _____________________ Data Collection Period: ___________________________ Date of Analysis: ____________________________ Type of Data Analyzed: (Check the data point you are analyzing.) Student Performance Data: Implementation Data _____ ITBS/ITED _____ ___________________________________ _____ Diagnostic: ______________________ _____ ___________________________________ _____ Grades or Progress Indicators _____ ___________________________________ _____ Other: __________________________ _____ ___________________________________ Other Data: _____ ___________________________________ _____ ___________________________________ 1. What do you notice when you look at these data? What are you comfortable saying about student or staff performance based on these results? 2. What additional questions do these data generate? 3. What do these data indicate students need to work on? Based on these data, what can we infer teachers/administrators need to work on? 4. What do the results and their implications mean for your building’s/district’s action plan? Diagnosis Phase: Analyze and Report Data – Response Sheet ©2008 Diagnosis - 130 Iowa Support System for Schools and Districts in Need of Assistance Analyze and Report Data – Response Sheet Example Source: Iowa Professional Development Model Training Manual – Tool 2(data).8 (Adapted) This worksheet provides a structured way to facilitate a discussion about data. Recording the team’s responses to the questions regarding the data provides useful documentation about the findings and implications. This information will support goal setting and other decision making for the action plan. School Name: Westlake Middle School Data Analyzed By: Leadership Team Data Collection Period: 2003-2004 Spring ITBS Data_ Date of Analysis: Fall, 2005 Type of Data Analyzed: (Check the data point you are analyzing.) Student Performance Data: Implementation Data __X__ ITBS/ITED _____ ___________________________________ _____ Diagnostic: ______________________ _____ ___________________________________ _____ Grades or Progress Indicators _____ ___________________________________ _____ Other: __________________________ _____ ___________________________________ Other Data: _____ ___________________________________ _____ ___________________________________ 1. What do you notice when you look at these data? What are you comfortable saying about student or staff performance based on these results? There are 43 students in 8th grade. Fifteen (15) students are below grade level in math problem solving, 6 of which are at least 1 grade level below. None of these 6 students have an IEP. Ethnicity: 5 Hispanic students; 3 African- American students, 1 who is scoring 2 grade levels above grade level in math problem solving Gender: 24 females, 19 males SES: 50% of students are on free and reduced lunch; 50% of students eligible for F/R lunch are scoring at or above grade level in math problem solving IEP: None of the students scoring below grade level in problem solving have an IEP. Having an IEP does not appear to diminish student achievement. Being on free and reduced lunch does not necessarily diminish student achievement Low SES students in our building are capable of and many do score at grade level. 2. What additional questions do these data generate? What services are available for students who are achieving below grade level? 50% of students eligible for f/r lunch are achieving at or above grade level in problem solving, but what is happening for the other students who are on f/r lunch and not achieving? Diagnosis Phase: Analyze and Report Data – Response Sheet ©2008 Diagnosis - 131 Iowa Support System for Schools and Districts in Need of Assistance 3. What do these data indicate students need to work on? Based on these data, what can we infer teachers/administrators need to work on? Because our work in aligning curriculum, assessment, and instruction has not shown immediate student gains on the ITBS, we need to commit to long-term engagement in the alignment of curriculum, assessment, and instruction. Allocating time for teachers to have conversations about programming options for students who are achieving below grade level could impact instruction and student success. Investigating the factors that have impacted the low-SES students who were successful should result in positive actions/activities to impact the students’ success. 4. What do the results and their implications mean for your building’s/district’s action plan? Based upon the above indications, the leadership team would need to investigate which of those would have the most impact on the student achievement, and then give priority to the one(s) that would be most likely to produce immediate and significant student achievement gains. Diagnosis Phase: Analyze and Report Data – Response Sheet ©2008 Diagnosis - 132
