Cell Culture - eScholarShare
advertisement
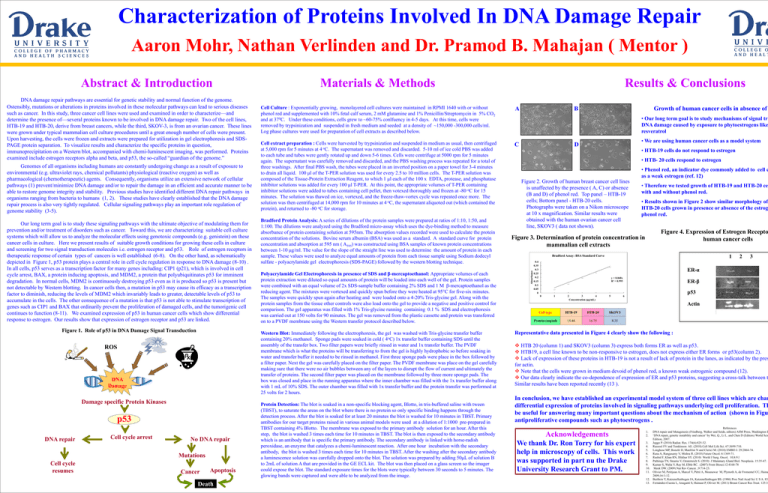
Characterization of Proteins Involved In DNA Damage Repair Aaron Mohr, Nathan Verlinden and Dr. Pramod B. Mahajan ( Mentor ) DNA damage repair pathways are essential for genetic stability and normal function of the genome. Ostensibly, mutations or alterations in proteins involved in these molecular pathways can lead to serious diseases such as cancer. In this study, three cancer cell lines were used and examined in order to characterize—and determine the presence of—several proteins known to be involved in DNA damage repair. Two of the cell lines, HTB-19 and HTB-20, derive from breast cancers, while the third, SKOV-3, is from an ovarian cancer. These lines were grown under typical mammalian cell culture procedures until a great enough number of cells were present. Upon harvesting, the cells were frozen and extracts were prepared for utilization in gel electrophoresis and SDSPAGE protein separation. To visualize results and characterize the specific proteins in question, immunoprecipitation on a Western blot, accompanied with chemi-luminescent imaging, was performed. Proteins examined include estrogen receptors alpha and beta, and p53, the so-called “guardian of the genome.” Genomes of all organisms including humans are constantly undergoing change as a result of exposure to environmental (e.g. ultraviolet rays, chemical pollutants) physiological (reactive oxygen) as well as pharmacological (chemotherapeutic) agents. Consequently, organisms utilize an extensive network of cellular pathways (1) prevent/minimize DNA damage and/or to repair the damage in an efficient and accurate manner to be able to restore genome integrity and stability. Previous studies have identified different DNA repair pathways in organisms ranging from bacteria to humans (1, 2). These studies have clearly established that the DNA damage repair process is also very tightly regulated. Cellular signaling pathways play an important role regulation of genome stability (3-5). Our long term goal is to study these signaling pathways with the ultimate objective of modulating them for prevention and/or treatment of disorders such as cancer. Toward this, we are characterizing suitable cell culture systems which will allow us to analyze the molecular effects using genotoxic compounds (e.g. genistein) on these cancer cells in culture. Here we present results of suitable growth conditions for growing these cells in culture and screening for two signal transduction molecules i.e. estrogen receptor and p53. Role of estrogen receptors in therapeutic response of certain types of cancers is well established (6-8). On the other hand, as schematically depicted in Figure 1, p53 protein plays a central role in cell cycle regulation in response to DNA damage (8-10) . In all cells, p53 serves as a transcription factor for many genes including: CIP1 (p21), which is involved in cell cycle arrest, BAX, a protein inducing apoptosis, and MDM2, a protein that polyubiquitinates p53 for imminent degradation. In normal cells, MDM2 is continuously destroying p53 even as it is produced so p53 is present but not detectable by Western blotting. In cancer cells then, a mutation in p53 may cause its efficacy as a transcription factor to diminish, reducing the levels of MDM2 which invariably leads to greater, detectable levels of p53 to accumulate in the cells. The other consequence of a mutation is that p53 is not able to stimulate transcription of genes such as CIP1 and BAX that ordinarily prevent the proliferation of damaged cells, and the tumorigenic cell continues to function (8-11). We examined expression of p53 in human cancer cells which show differential response to estrogen. Our results show that expression of estrogen receptor and p53 are linked. Figure 1. Role of p53 in DNA Damage Signal Transduction DNA Damage Damage specific Protein Kinases p53 Cell cycle arrest No DNA repair Mutations Cell cycle resumes Cell Culture : Exponentially growing, monolayered cell cultures were maintained in RPMI 1640 with or without phenol red and supplemented with 10% fetal calf serum, 2 mM glutamine and 1% Penicillin/Streptomycin in 5% CO2 and at 370C. Under these conditions, cells grew to ~60-75% conlfuency in 4-5 days. At this time, cells were removed by trypsinization and suspended in fresh medium and seeded at a density of ~150,000 -300,000 cells/ml. Log phase cultures were used for preparation of cell extracts as described below. Cell extract preparation : Cells were harvested by trypsinization and suspended in medium as usual, then centrifuged at 5,000 rpm for 5 minutes at 4 oC. The supernatant was removed and discarded. 5-10 ml of ice cold PBS was added to each tube and tubes were gently rotated up and down 5-6 times. Cells were centrifuge at 5000 rpm for 5 minutes again. The supernatant was carefully removed and discarded, and the PBS washing process was repeated for a total of three washings. After final PBS wash, the tubes were placed in an inverted position on a paper towel for 3-4 minutes to drain all liquid. 100 μl of the T-PER solution was used for every 2.5 to 10 million cells. The T-PER solution was composed of the Tissue-Protein Extraction Reagent, to which 1 μl each of the 100 x EDTA, protease, and phosphatase inhibitor solutions was added for every 100 μl T-PER. At this point, the appropriate volumes of T-PER containing inhibitor solutions were added to tubes containing cell pellet, then votexed thoroughly and frozen at -80 oC for 15 minutes. The solution was thawed on ice, vortexed, and the freeze-thaw-vortex cycle was repeated once more. The solution was then centrifuged at 14,000 rpm for 10 minutes at 4 oC, the supernatant aliquoted out (which contained the protein), and returned to -80 oC for storage. Bradford Protein Analysis: A series of dilutions of the protein samples were prepared at ratios of 1:10, 1:50, and 1:100. The dilutions were analyzed using the Bradford micro-assay which uses the dye-binding method to measure absorbance of protein containing solution at 595nm. The absorption values recorded were used to calculate the protein concentration of the solutions. Bovine serum albumin (BSA) was used as a standard. A standard curve for protein concentration and absorption at 595 nm ( A595) was constructed using BSA samples of known protein concentrations between 1-10 μg/ml. The value for the slope of the straight line was used to determine the amount of protein in each sample. These values were used to analyze equal amounts of protein from each tissue sample using Sodium dodecyl sulfate - polyacrylamide gel electrophoresis (SDS-PAGE) followed by the western blotting technique. Polyacrylamide Gel Electrophoresis in presence of SDS and β-mercaptoethanol: Appropriate volumes of each protein extraction were diluted so equal amounts of protein will be loaded into each well of the gel. Protein samples were combined with an equal volume of 2x SDS-sample buffer containing 2% SDS and 1 M β-mercaptoethanol as the reducing agent. The mixtures were vortexed and quickly spun before they were heated at 95°C for five-six minutes. The samples were quickly spun again after heating and were loaded onto a 4-20% Tris-glycine gel. Along with the protein samples from the tissue other controls were also load onto the gel to provide a negative and positive control for comparison. The gel apparatus was filled with 1% Tris-glycine running containing 0.1 % SDS and electrophoresis was carried out at 150 volts for 90 minutes. The gel was removed from the plastic cassette and protein was transferred on to a PVDF membrane using the Western transfer protocol described below. Western Blot: Immediately following the electrophoresis, the gel was washed with Tris-glycine transfer buffer containing 20% methanol. Sponge pads were soaked in cold ( 4oC) 1x transfer buffer containing SDS until the assembly of the transfer box. Two filter papers were briefly rinsed in water and 1x transfer buffer. The PVDF membrane which is what the proteins will be transferring to from the gel is highly hydrophobic so before soaking in water and transfer buffer it needed to be rinsed in methanol. First three sponge pads were place in the box followed by a filter paper. Next the gel was carefully placed on the filter paper. The PVDF membrane was place on the gel carefully making sure that there were no air bubbles between any of the layers to disrupt the flow of current and ultimately the transfer of proteins. The second filter paper was placed on the membrane followed by three more sponge pads. The box was closed and place in the running apparatus where the inner chamber was filled with the 1x transfer buffer along with 1 mL of 10% SDS. The outer chamber was filled with 1x transfer buffer and the protein transfer was performed at 25 volts for 2 hours. ROS DNA repair Materials & Methods Cancer Apoptosis Death Protein Detection: The blot is soaked in a non-specific blocking agent, Blotto, in tris-buffered saline with tween (TBST), to saturate the areas on the blot where there is no protein so only specific binding happens through the detection process. After the blot is soaked for at least 20 minutes the blot is washed for 10 minutes in TBST. Primary antibodies for our target proteins raised in various animal models were used at a dilution of 1:1000 pre-prepared in TBST containing 4% Blotto. The membrane was exposed to the primary antibody solution for an hour. After this step, the blot is washed 3 times each time for 10 minutes in TBST. The blot is then exposed to the secondary antibody which is an antibody that is specific the primary antibody. The secondary antibody is linked with horse-radish peroxidase, an enzyme that catalyzes a chemi-luminescent reaction. After one hour incubation with the secondary antibody, the blot is washed 3 times each time for 10 minutes in TBST. After the washing after the secondary antibody a luminescence solution was carefully dropped onto the blot. The solution was prepared by adding 50μL of solution B to 2mL of solution A that are provided in the GE ECL kit. The blot was then placed on a glass screen so the imager could expose the blot. The standard exposure times for the blots were typically between 30 seconds to 5 minutes. The glowing bands were captured and were able to be analyzed from the image. Results & Conclusions A Growth of human cancer cells in absence of B • Our long term goal is to study mechanisms of signal tra DNA damage caused by exposure to phytoestrogens like resveratrol C • We are using human cancer cells as a model system D • HTB-19 cells do not respond to estrogen • HTB- 20 cells respond to estrogen • Phenol red, an indicator dye commonly added to cell c as a weak estrogen (ref. 12) Figure 2. Growth of human breast cancer cell lines is unaffected by the presence ( A, C) or absence (B and D) of phenol red. Top panel – HTB-19 cells; Bottom panel - HTB-20 cells. Photographs were taken on a Nikon microscope at 10 x magnification. Similar results were obtained with the human ovarian cancer cell line, SKOV3 ( data not shown). • Therefore we tested growth of HTB-19 and HTB-20 cel with and without phenol red. • Results shown in Figure 2 show similar morphology of HTB-20 cells grown in presence or absence of the estrog phenol red. Figure 4. Expression of Estrogen Recepto human cancer cells Figure 3. Determination of protein concentration in mammalian cell extracts 1 Bradford Assay: BSA Standard Curve Absorbance Abstract & Introduction 0.4 0.35 0.3 0.25 0.2 0.15 0.1 0.05 0 2 3 ER-α y = 0.068x R² = 0.995 ER-β p53 0 1 2 3 4 Concentration (μg/mL) 5 6 Actin Cell type HTB-19 HTB-20 SKOV3 Protein (mg/ml) 15.46 16.75 8.35 Representative data presented in Figure 4 clearly show the following : HTB 20 (column 1) and SKOV3 (column 3) express both forms ER as well as p53. HTB19, a cell line known to be non-responsive to estrogen, does not express either ER forms or p53(column 2). Lack of expression of these proteins in HTB-19 is not a result of lack of protein in the lanes, as indicated by the pres for actin. Note that the cells were grown in medium devoid of phenol red, a known weak estrogenic compound (12). Our data clearly indicate the co-dependence of expression of ER and p53 proteins, suggesting a cross-talk between t Similar results have been reported recently (13 ). In conclusion, we have established an experimental model system of three cell lines which are char differential expression of proteins involved in signaling pathways underlying cell proliferation. Th be useful for answering many important questions about the mechanism of action (shown in Figu antiproliferative compounds such as phytoestrogens . Acknowledgements We thank Dr. Ron Torry for his expert help in microscopy of cells. This work was supported in part nu the Drake University Research Grant to PM. 1. 2. 3. 4. 5. 6. 7. 8. 9. 10. 11. 12. 13. References DNA repair and Mutagenesis (Friedberg, Walker and Seide, editors) ASM Press, Washington D ‘DNA repair, genetic instability and cancer’ by Wei, Q., Li L. and Chen D (Editors) World Scie Edition, 2007. Jeggo P. (2010) Radiat. Res. 174(6):825-32. Rassool FV and Tomkinson AE. (2010) Cell Mol Life Sci. 67:3699-710. Longhese MP, Bonetti D, Manfrini N and Clerici M. (2010) EMBO J. 29:2864-74. Rana A, Rangasamy V, Mishra R. (2010) Future Oncol. 6:1369-71. Rashid F, Khan RN, Iftikhar SY. (2010) World J Surg. Oncol. 10;8:9.l Pathiraja TN, Stearns V, Oesterreich S. (2010) J Mammary Gland Biol. Neoplasia. 15:35-47. Kumar S, Walia V, Ray M, Elble RC. (2007) Front Biosci.12:4168-78 Meek DW. (2009) Nat Rev Cancer. ;9:714-23. Olivier M, Petitjean A, Marcel V, Pétré A, Mounawar M, Plymoth A, de Fromentel CC, Haina 2009;16:1-12. Berthois Y, Katzenellenbogen JA, Katzenellenbogen BS. (1986) Proc Natl Acad Sci U S A. 83: Fernández-Cuesta L, Anaganti S, Hainaut P, Olivier M. (2011) Breast Cancer Res Treat. 125:35

