What is Needed to Achieve New Zealand’s Smokefree
Nation Goal: Results from a Forecasting Model
Takayoshi IKEDA*1, Linda COBIAC1,2, Nhung NGHIEM1, Kristie CARTER1, Nick WILSON1, Tony BLAKELY1
1 Department of Public Health, University of Otago, Wellington, New Zealand
2 School of Population Health, University of Queensland, Australia
*Presenter, E-mail: tak.ikeda@otago.ac.nz
Introduction
There is growing international interest in ending
the tobacco epidemic. In New Zealand (NZ), the
Government has a goal of a “Smokefree Nation
by 2025”1 (i.e. <5% smoking prevalence). This is
to benefit the health of all NZers but there is a
particular need to reduce health inequalities by
improving health for the Māori population
(indigenous people)2.
The 10th Asia Pacific Conference on
Tobacco or Health in Chiba, Japan
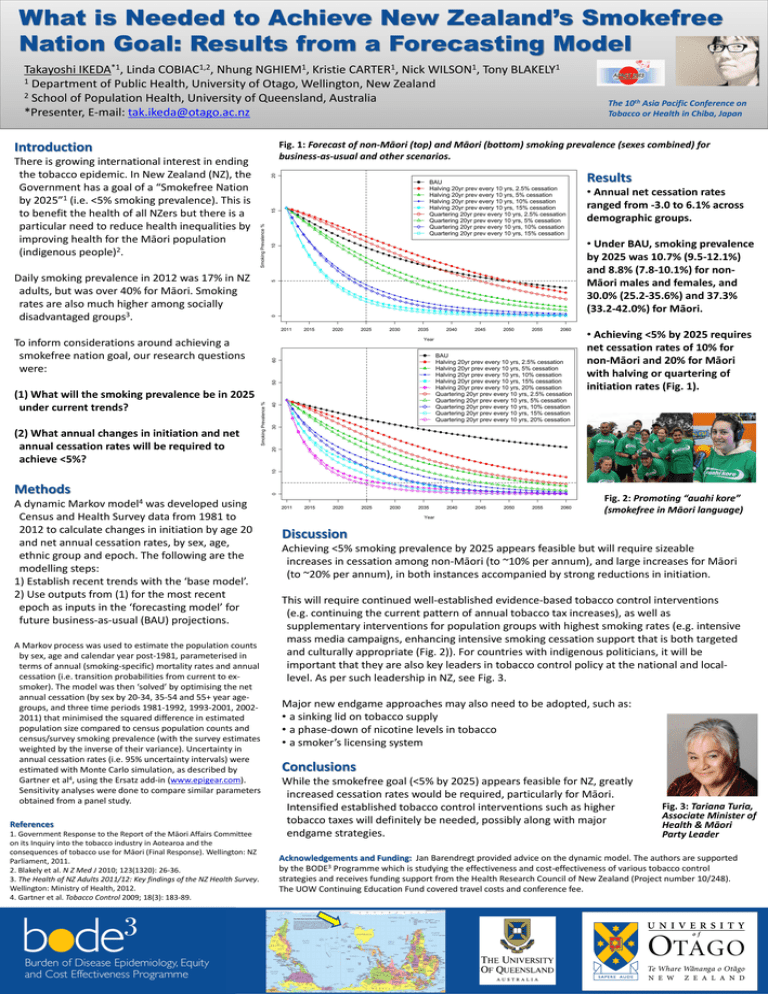
Fig. 1: Forecast of non-Māori (top) and Māori (bottom) smoking prevalence (sexes combined) for
business-as-usual and other scenarios.
Results
• Annual net cessation rates
ranged from -3.0 to 6.1% across
demographic groups.
• Under BAU, smoking prevalence
by 2025 was 10.7% (9.5-12.1%)
and 8.8% (7.8-10.1%) for nonMāori males and females, and
30.0% (25.2-35.6%) and 37.3%
(33.2-42.0%) for Māori.
Daily smoking prevalence in 2012 was 17% in NZ
adults, but was over 40% for Māori. Smoking
rates are also much higher among socially
disadvantaged groups3.
• Achieving <5% by 2025 requires
net cessation rates of 10% for
non-Māori and 20% for Māori
with halving or quartering of
initiation rates (Fig. 1).
To inform considerations around achieving a
smokefree nation goal, our research questions
were:
(1) What will the smoking prevalence be in 2025
under current trends?
(2) What annual changes in initiation and net
annual cessation rates will be required to
achieve <5%?
Methods
Fig. 2: Promoting “auahi kore”
(smokefree in Māori language)
model4
A dynamic Markov
was developed using
Census and Health Survey data from 1981 to
2012 to calculate changes in initiation by age 20
and net annual cessation rates, by sex, age,
ethnic group and epoch. The following are the
modelling steps:
1) Establish recent trends with the ‘base model’.
2) Use outputs from (1) for the most recent
epoch as inputs in the ‘forecasting model’ for
future business-as-usual (BAU) projections.
A Markov process was used to estimate the population counts
by sex, age and calendar year post-1981, parameterised in
terms of annual (smoking-specific) mortality rates and annual
cessation (i.e. transition probabilities from current to exsmoker). The model was then ‘solved’ by optimising the net
annual cessation (by sex by 20-34, 35-54 and 55+ year agegroups, and three time periods 1981-1992, 1993-2001, 20022011) that minimised the squared difference in estimated
population size compared to census population counts and
census/survey smoking prevalence (with the survey estimates
weighted by the inverse of their variance). Uncertainty in
annual cessation rates (i.e. 95% uncertainty intervals) were
estimated with Monte Carlo simulation, as described by
Gartner et al4, using the Ersatz add-in (www.epigear.com).
Sensitivity analyses were done to compare similar parameters
obtained from a panel study.
References
1. Government Response to the Report of the Māori Affairs Committee
on its Inquiry into the tobacco industry in Aotearoa and the
consequences of tobacco use for Māori (Final Response). Wellington: NZ
Parliament, 2011.
2. Blakely et al. N Z Med J 2010; 123(1320): 26-36.
3. The Health of NZ Adults 2011/12: Key findings of the NZ Health Survey.
Wellington: Ministry of Health, 2012.
4. Gartner et al. Tobacco Control 2009; 18(3): 183-89.
Discussion
Achieving <5% smoking prevalence by 2025 appears feasible but will require sizeable
increases in cessation among non-Māori (to ~10% per annum), and large increases for Māori
(to ~20% per annum), in both instances accompanied by strong reductions in initiation.
This will require continued well-established evidence-based tobacco control interventions
(e.g. continuing the current pattern of annual tobacco tax increases), as well as
supplementary interventions for population groups with highest smoking rates (e.g. intensive
mass media campaigns, enhancing intensive smoking cessation support that is both targeted
and culturally appropriate (Fig. 2)). For countries with indigenous politicians, it will be
important that they are also key leaders in tobacco control policy at the national and locallevel. As per such leadership in NZ, see Fig. 3.
Major new endgame approaches may also need to be adopted, such as:
• a sinking lid on tobacco supply
• a phase-down of nicotine levels in tobacco
• a smoker’s licensing system
Conclusions
While the smokefree goal (<5% by 2025) appears feasible for NZ, greatly
increased cessation rates would be required, particularly for Māori.
Intensified established tobacco control interventions such as higher
tobacco taxes will definitely be needed, possibly along with major
endgame strategies.
Fig. 3: Tariana Turia,
Associate Minister of
Health & Māori
Party Leader
Acknowledgements and Funding: Jan Barendregt provided advice on the dynamic model. The authors are supported
by the BODE3 Programme which is studying the effectiveness and cost-effectiveness of various tobacco control
strategies and receives funding support from the Health Research Council of New Zealand (Project number 10/248).
The UOW Continuing Education Fund covered travel costs and conference fee.

