51312326
advertisement
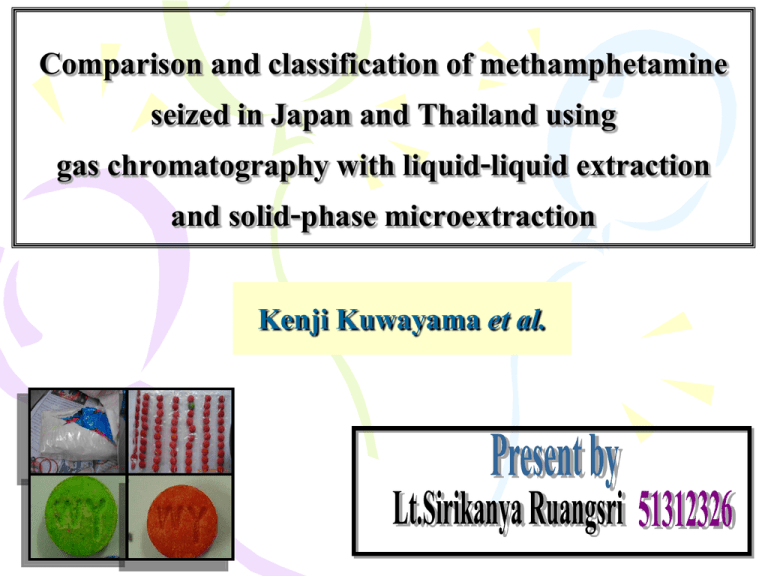
Comparison and classification of methamphetamine seized in Japan and Thailand using gas chromatography with liquid-liquid extraction and solid-phase microextraction Kenji Kuwayama et al. 2 INTRODUCTION 3 Methamphetamine Caffeine Amphetamine 4 Methamphetamine Amphetamine 5 eat inject smoke inhale 6 H N Methamphetamine OH O 1-phenyl-2-propanone (P2P) H N Ephedrine compound 7 Presumptive Test Thin Layer Chromatography (TLC) Gas Chromatography Flame Ionization Detector (GC-FID) Gas Chromatography Mass Spectrometry (GC-MS) High Performance Liquid Chromatography (HPLC) Fourier Transform Infrared (FTIR) Spectroscopy ทีม่ า : United Nations Office on Drugs and Crime 8 Two GC method for MA impurity profiling NRIPS ONCB The national Research Intitute of Police Science The Office of the Narcotics Control Board JAPAN THAILAND 9 JAPAN THAI LLE 10 Chromatograms obtained using the ONCB method tablet THAI crystal 11 Chromatograms obtained from an MA crystal ONCB NRIPS 12 The aim of this study • Improve the analytical method for profiling MA impurity • Compare and classification MA crystals seized in different countries • Information in criminal investigation ; traffic routes , the source of supply and relationships between seizures 13 Method Liquid-Liquid Extraction ( LLE ) Solid-Phase Microextraction (SPME ) GC-FID & GC-MS 14 Technique LLE solution sample GC Shaking centrifuge Organic layer 15 15 Technique SPME SPME fiber Head space SPME fiber GC 16 Technique GC-FID FID 17 Technique GC-MS 18 MATERIALS AND METHODS 19 Reagents and chemical 1. MA.HCl crystals seized in Japan (69) and Thailand (42) 2. Std. d-MA.HCl 3. l-ephedrine.HCl 4. dl-Dimethylamphetamine.HCl 5. cis-1,2-dimethyl-3-phenylaziridine 6. n-Alkanes : Internal Standard 7. Solvents 8. SPME holder and fiber coated with DVB/CAR/PDMS 9. Inlet liner for SPME 20 Gas chromatographic analysis 1.GC-FID Agilent – 6890 Auto inject : 7683 21 2.GC-MS Agilent – 6890 Agilent 5973N MSD 22 COLUMN GC-FID & GC-MS DB-5 capillary column ( 30 m. x 0.32 mm. x film thickness 1.0 µm. ) 23 LLE procedure ( NRIPS ) buffer solution1 mL Shaking MA.HCl 50 mg GC Istd. 0.5 mL Ethyl acetate + Istd. Centrifuge 3000 rpm 5 min n-decane (C10,IS1) n-pentadecane (C15,IS2) n-eicosane (C20,IS3) 24 24 n-octacosane (C28,IS4) 0.02 mg/ml SPME procedure Headspace at 85OC 35 min SPME fiber MA.HCl 10 mg SPME fiber GC 25 Condition: GC-FID & GC-MS Initial temperature : 50 0C held 1 min. increase of 10 0C/min. to 300 0C held 10 min. 0 240 C Inject temperature : Detector temperature : 300 0C Carrier gas : He (g) flow rate 2 mL / min. Injection : 1 µL splitless mode Condition for SPME were the same as those for LLE 26 RESULTS 27 Data processing for LLE & SPME • Peak data integrated by Chemstation software • Processed using the Drug Micro-Component Analysis & Comparison System (DMCPS) Calculation of Euclidean distances Cluster analysis by Ward method 28 Data processing for LLE Istd. 29 Typical chromatograms obtained from MA crystal using NRIPS Istd. Ephedrine (pseudoephedrine) 30 Data processing for SPME 31 Typical chromatograms obtained samples by SPME Empty vial without MA 32 Typical chromatograms obtained samples by SPME 33 1.Optimization of analytical procedure LLE ONCB optimized for the analyzed of MA tablet NRIPS optimized for the analyzed of MA crystal considered more efficient than the ONCB 34 2.Cluster analysis of sample seized in Japan and Thailand MA crystals seized Japan = 69 sample Thai = 42 sample NRIPS method Cluster analysis Fourteen characteristic impurity peak 35 2.Cluster analysis of sample seized in Japan and Thailand NRIPS method No.sam. (J/T) 15/19 25/0 17/15 36 12/8 Typical chromatograms of MA samples in each group using the NRIPS High purity Group A Group B 1,3-dimethyl-2-phenyl naphthalene 1-benzyl-3-methylnaphthalene 37 Typical chromatograms of MA samples in each group using the NRIPS cis-1,2-dimethyl-3-phenylaziridine Group C Ephedrine (pseudoephedrine) Group D 38 3.Comparison and classification of sample in the high purity group by SPME When MA crystals were extracted with SPME and analyzed by GC (SPME ), the chromatograms had many impurities while the chromatograms in case of LLE had few impurities MA Many impurity Characteristic peaks for data processing seven peaks 39 3.Comparison and classification of sample in the high purity group by SPME 15/19 SPME NRIPS 40 3.Comparison and classification of sample in the high purity group by SPME Chromatograms were distinguished clearly from SPME method , whereas in the case of LLE it was difficult to compare and classify samples in the highpurity group because there were so few impurities. The SPME method enables us to compare and classify high-purity MA 41 CONCLUSION 42 Compared LLE ONCB NRIPS Superior for detecting and separating MA impurities 14 peaks characteristic Classified into four groups 43 LLE SPME Effective for comparing high-purity MA because it detected many characteristic peaks 44 45 QUESTION 46
