PPT - IAEA Nuclear Data Services
advertisement
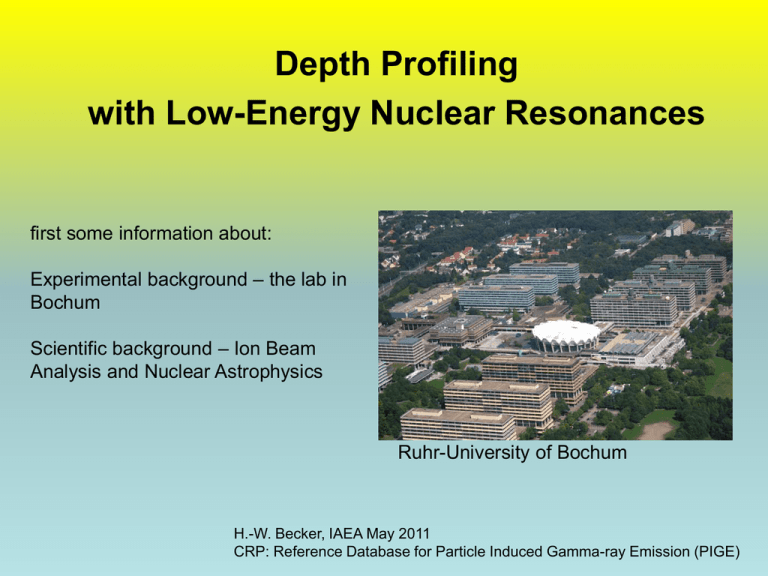
Depth Profiling with Low-Energy Nuclear Resonances first some information about: Experimental background – the lab in Bochum Scientific background – Ion Beam Analysis and Nuclear Astrophysics Ruhr-University of Bochum H.-W. Becker, IAEA May 2011 CRP: Reference Database for Particle Induced Gamma-ray Emission (PIGE) The Lab in Bochum Ruhr-Uni-Bochum 4 MV Dynamitron Tandem 500 keV – open air – single ended 100 kV – Implanter (not shown) The NRRA set-up in Bochum P = 2x10⁻⁹ mbar The 4 summing crystal 12x12 inch NaI(TL) with borehole high efficiency ( 50% photopeak efficiency at 2 MeV) integrating over angular distributions summing cascades into one peak Ion Beam Analysis and Nuclear Astrophysics Nuclear Resonance Reaction Analysis example 15N(p,a g)12C Wirkungsquerschnitt [rel.] 10 5 sample e E> = ER Detektor 10 4 10 3 10 2 10 1 10 0 10 -1 6.2 6.3 6.4 6.5 6.6 6.7 6.8 6.9 7 Strahlenergie [MeV] E = ER E > ER sample 100.28 700 6000 600 Beam Energy = 6.446 MeV 5000 4000 400 counts Counts 500 300 200 3000 2000 100 1000 0 0 2 4 6 8 10 12 Gamma Ray Energy (MeV) 0 6.300 6.350 6.400 6.450 6.500 6.550 6.600 energy [MeV] detector resolution for identifing the g-ray only 6.650 6.700 6.750 6.800 6.850 What determines the depth resolution in NRRA ? beam sample 10 5 10 4 10 3 10 2 10 1 10 0 10 -1 6.2 6.3 6.4 6.5 6.6 6.7 6.8 6.9 7 stopping power and total energy resolution: sample 100.28 6000 5000 1.) resonance width Γ 2.) beam energy resolution ΔEbeam 3.) Doppler broadening ΔED counts 4000 3000 2000 1000 0 6.300 6.350 6.400 6.450 6.500 6.550 6.600 energy [MeV] 6.650 6.700 6.750 6.800 6.850 stopping power for protons 180 160 stopping power: 140 keV/ µm 120 100 Silicon 80 Carbon 60 40 20 0 1 10 100 1000 10000 100000 proton energy [keV] total energy resolution: to get a feeling: 1nm requires 70 eV resolution at 400 keV 1.) resonance width Γ 2.) beam energy resolution ΔEbeam 3.) Doppler broadening ΔED E D 4 ln 2 m p E p k T F mt e.g. for Si ~ 70 eV at room temperature by tilting the sample sub-nm resolution possible The 500 kV machine in Bochum: 4500 Lewis-peak Ep = 417 keV Resonanz in 29Si 4000 3500 3000 yield total resolution ~ 70 eV (mainly Doppler broadening) HV – ripple 30-40 eV 2500 1 nm 2000 1500 1000 500 0 415.8 416 416.2 416.4 416.6 416.8 417 417.2 proton energy stability: gamma yield at 50% point stability test 300 250 20 eV 200 150 100 50 0 10 20 30 40 time [min] 50 60 70 The ultimate resolution: 21Ne(p,g)22Na, Ep = 272 keV Resonance 21Ne solid target (at 8 K !) resonance width 1 eV beam resolution 10 eV Dopplerbroadening 17 eV Lewis peak normal thick target yield Phys. Rev. B 58 1103 (1998) Nuclear Resonance Reaction Analysis with Proton Induced Low Energy Resonances some proton induced resonances between 150 keV and 500 keV: 26Mg(p,g) 13C(p,g) 27Al(p,g) 25Mg(p,g) 15N(p,ag) 24Mg(p,g) 29Si(p,g) 27Al(p,g) 25Mg(p,g) 28Si(p,g) 19F(p,ag) 26Mg(p,g) 27Al(p,g) 29Si(p,g) 25Mg(p,g) 23Na(p,g) 27Al(p,g) 26Mg(p,g) 14N(p,g) 21Ne(p,g) 27Al(p,g) 24Mg(p,g) 11B(p,3a) 18O(p,a) 0,0001 0,001 0,01 0,1 1 resonance strength ( *abundance) 10 100 One example – Diffusion studies in Olivin (making use of the isotope sensitivity of NRRA) Motivation: mechanical properties pinning down temperature, pressure and time-scales from observation There is a correlation microscopic properties between diffusion and plastic flow Knowledge of the diffusion parameters necessary ! Measurement of diffusion processes in the laboratory: time scale 100 mm B 100000 years temperature scale Chemical potential A AB A e.g.: A + B -> AB Natur Experiment B 10 nm ~ 8 days Q D D0 exp , Q = activation energy kT production of layers with well defined stoichiometry Investigation of Si diffusion in Olivin Olivin (Fe,Mg)2SiO4 Testfall: Si Diffusion in Olivin (Diffusionskonstanten aus SIMS Messungen bekannt) native sample artificial Olivin layer enriched in 29Si (PLD) R. Dohmen, S. Chakraborty, H.-W. Becker Geophys. Res. Lett. 29 (2002) 261-264 results: 950 reference layer, ~ 35 nm dick 850 gamma yield 750 650 first temperature process 550 450 second temperature process 350 250 150 50 -50 410 415 420 425 430 435 440 1.15442 1.2 proton energy [keV] 0 Bj concentration diffusion constant in good agreement with our earlier data normalized concentartion 1 0.8 ampi , 083 65083 0.6 initialj , 083 75083 Dliter 0.4 0.2 0.05 0 40 hr20 20 0 20 40 60 80 xj , ampi , 1hr15, initialj , 1hr, y liter depth [nm] distance from the surface (nm) 100 120 140 150 Handbook of Modern Ion Beam Material Analysis (1995) information appears to be poor …. but lot of data are available from Nuclear Astrophysics and increasingly from Material science a first attempt to collect the data (~ 1995) … but a lot of data available and still coming It would be nice to evaluate, extract and bring in a comprehensive form for material analysis: • • • • • • • • The reaction and the abundance of the isotope Resonance energy ER Q-value or excitation energy Resonance strength g or cross section Resonance width Non resonant cross section, next resonance g - ray energies, plots of spectra would be useful Meaning of the values for practical purposes summary: • Nuclear Reaction Analysis with low energy resonances can be a powerfull tool for depth profiling in the nm range • There are quite a few reonances between 150 kV und 500 kV offering various opportunities for applications • Sensitivity for isotopes offers special applications • Probably most if not all necessary data are available • Data evaluation collection and translation into material science lenguage desirable …
