Horizontal Eddy Diffusivity
advertisement
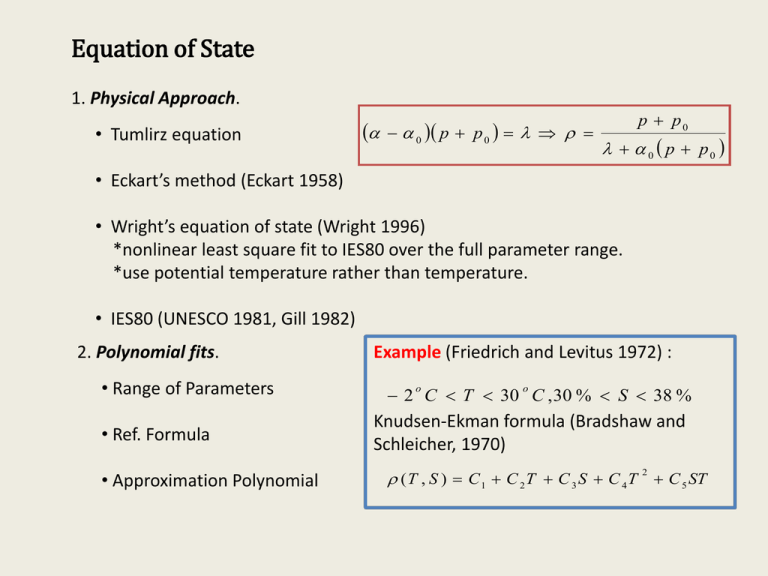
Equation of State 1. Physical Approach. • Tumlirz equation 0 p p 0 p p0 0 p p0 • Eckart’s method (Eckart 1958) • Wright’s equation of state (Wright 1996) *nonlinear least square fit to IES80 over the full parameter range. *use potential temperature rather than temperature. • IES80 (UNESCO 1981, Gill 1982) 2. Polynomial fits. • Range of Parameters • Ref. Formula • Approximation Polynomial Example (Friedrich and Levitus 1972) : 2 C T 30 C , 30 % S 38 % o o Knudsen-Ekman formula (Bradshaw and Schleicher, 1970) ( T , S ) C 1 C 2 T C 3 S C 4 T C 5 ST 2 Effective Calculation of Sea Water Density 1. Sanderson, Dietrich, Stilgoe 2001. 2. Accuracy and Computational Advantage over UES80 and Wright’s E.O.S based on the choice of ocean model and problem being solved. In a 3D ocean model solving a deep convection problem: 7% drop and 15% drop of computational cost for nonhydro. and hydro. cases relative to UES80. 3. Computational cost is high because of calculation for coefficients. *updating only many time steps. *In deep ocean, where temperature and Salinity are nearly constant. Taylor expansion about the time mean state. Table 1. Brief comparison of different E.O.S. employed in Ocean Model Simple Wright’s UNESCO Comput. Cost 2FP 21FP Precision Single Double Single FL_EOS_OP 1 2 3 Linear Nonlinear1 Nonlinear2 6FP+1SB 8FP+1SB Single Single Single 4 5 6 85FP+1SB 4FP+1SB Accuracy Evaluation D(t,S,P) D(t E 0,S (E,Pt ) (C ED t EtC E S S ) D (P P ) D(t,S,P) )S)t D (S tt t (t tS D(t,S,P) r C r 0 r r tt t)t S SC Sr S p r t Brief Summary where E 0 D(t ,S ,P SDSt t r D S S r D00.5DD(t t D tS2trr )S r D t t r D S S r D(t,S,P) D0 t r) D where r D tt r r ,S r ,P where C0 D(tr t r ,S ,P )-D t D S 0 .5 D tt t r r r t r S r 2 E t D t D tt t r D tS S r C D D t • Computational tcosts t drop ttbyr using new equation of state. E S D S D tS t r C tt 0 .5 D tt E tt .5DD • At deep ocean tt temperature and salinity change slightly, the local linear C 0where S S fit (linear) Eis adequate, and has the computational advantage. D tS tS • Near surface nonlinear local equation (nonlinear 2) enables accurate density over a wide range of temperature and salinity, like coastal regions. • For surface water away from coastal area where salinity doesn’t change a lot, but temperature still varies, nonlinear local equation (nonlinear1) might be useful. [Sanderson et al., 2001] TIMCOM Results 101 Outline • Horizontal Eddy Diffusivity • Parameterization of Horizontal Eddy Diffusivity • Vertical Eddy Diffusivity • Parameterization of Vertical Eddy Diffusivity Copyright ©2011 The TIMCOM Development Group, Yu-Chiao Liang Horizontal Eddy Diffusivity, “κ ” • Two different estimates of κ can be obtained from altimetric data(TOPEX/POSEIDON) : 1. Κ =2αKETalt , obtained from scale analysis . 2. Κ=CτΨ , obtained from estimating the satellite altimetry. • Effective Diffusivity, calculated by released tracer governed by 2D advection-diffusion equation. c t u c c 2 L eq ( e , t ) 2 eff ( e , t ) L min ( e , t ) 2 2 m s [Keffer & Holloway, 1988; Stammer, 1997 &2005; Shuckburgh, 2008] 1 Horizontal Eddy Diffusivity, “κ ”, Parameterization • First-order closure. Constant coefficients. • Non-constant formula. 1. Simple formula. 2. Smagorinsky model for atmosphere, Smagorinsky, 1963. • Heisenberg similarity. • Lateral stresses. 3. Isopycnal mixing parameterization, Redi, 1982; McDougall, 1997. • More nature comparative to Cartesian grid(geodesic coordinate). • Oceanic turbulence follows the isopycnal layers. Meso-scale eddies. • Eliassen-Palm flux has finite amplitude in isopycnal coordinate frame. • For long-term integrations of ocean models, the poleward heat flux is governed by the diapycnal effects. 4. Energy and momentum conservation, Wajsowicz, 1993, and Anisotropic mixing, Large, et al., 2001; Griffies, 2000. Vertical Eddy Diffusivity, “κ ” • Dissipative medium, Kant (1754) -> Ekman (1905) -> G.I. Taylor (1919) -> Jeffreys & Heiskanen (1921) -> Munk & MacDonald (1960) -> Cox & Sandstrom (1962) -> …… • Buoyancy frequency, N(z), and the one-dimensional model (below 1000 m): w C i z Ci 2 z 2 0 In the process of obtaining the solution, κ represents a turbulent eddy coefficient. • Globally averaged vertical eddy diffusivity: 1.0x10⁻⁴ m2/s • Open-Ocean vertical eddy diffusivity: 1.0x10⁻⁵ m2/s • Local vertical eddy diffusivity: 1.0x10⁻³ m2/s -> 1.0x10⁻¹ m2/s [Munk, 1966; Wunsch & Ferrari, 2004; Gregg, 1991; Stewart 2005, http://0rz.tw/FcP4L] Vertical Eddy Diffusivity, “κ ” [Wunsch & Ferrari, 2004] • However, κ is spatially highly variable. • Averaged κ below about 1000m : 1.0x10⁻⁴ m2/s (Munk & Wunsch, 1998) • Moreover, they found κ change significantly with depth. • By fitting surfaces to the observed density field, 1. In the North Atlantic, between 800 m and 2000 m, κ= 1.0x10⁻⁵ m2/s (Olbers etal., 1985) 2. In the Southern Ocean, between 100 m and 2500 m, κ= 1.0x10⁻⁴ m2/s (with some regions reach much larger values, 1.0x10⁻³ m2/s ) 3. Direct Estimates, by bulk fluid properties. Interior Vertical Eddy Diffusivity, “κ ” • Microstructure Measurements. (Osborn & Cox, 1972; Osborn, 1980) “Shears”. • Mixing in the Open ocean area V.S. Boundaries. Mixing of the Upper Ocean 1. In the open ocean upper 1000 m, below the mixed layer, κ can’t exceed 1.0x10⁻⁵ m2/s. (Gregg, 1987) 2. Use tracer-releasing method. (Ledwell et al., 1998,2000). 3. For supporting the observed circulation, one tenth of the value might be adopted. 4. More mixing happens at boundaries. (Ledwell & Hickey, 1995) Abyssal Mixing 1. High-accuracy measurements in 1990’s. 2. κ< O(10-5 m2/s) over abyssal plains and other simple structures. (Toole er al., 1994; Polzin et al., 1997) Contradiction to dependence on N(z). 3. κ increases with depth (Ledwell et al., 2000); over continental slopes (Polzin, 2002); and in some abyssal passages. [Sanderson et al., 2001] Deep Ocean Diapycnal Diffusivity ( 950-1450 m ) 1. Hibiya, Nagasawa, and Niwa, 2006, Hibiya and Nagasawa, 2004. 2. Expendable Current Profiler (XCP) -> An empirical relationship between estimated diapycnal diffusivity and the numerically predicted, available energy density of the semidiurnal internal tide. -> use numerically predicted energy density incorporating into the relationship to obtain the global distribution of diapycnal diffusivity in the thermohaline. 3. The estimated diapycnal diffusivities are dependent on the latitude. Values of the estimated diapycnal diffusivities: • Near the Hawaiian Ridge(~25oN) & Izu-Ogasawara Ridge (~28oN) : 1.5x10⁻⁴ m2s-1 • As the latitude exceeds 30oN : 0.2x10⁻⁴ m2s-1 • Near the Aleutian Ridge (~52oN) & the Emperor Seamount (~38oN) : 0.1x10⁻⁴ m2s-1 Vertical Mixing Parameterization (Only in Mixed layer) Bulk Formula Vertical Mixing Formula 1. Kraus and Turner, 1967; Price, et al.,1986; Chen, et al.,1994 1. Pacanowski and Philander, 1981 (PP); Mellor and Yamada, 1982; Large et al., 1994 (KPP); KPP Canoto and Dubovikov, 1996.Model Present Levitus data 2. Mixing length theory + turbulence closure. Partly based on the Richardson’s concept. 2. Considering the solar radiation, energy input from winds, and dissipation within one layer. 3. Compute layer depth and temperature. 3. Employed in our ocean model. • Meso-scale eddies, Gent and McWilliams, 1990 (GM90) • Parameterization of Eddy Fluxes near Ocean Boundaries, Ferrari, 2007 • Suppression of Eddy Diffusivity across Jets in the Southern Ocean, Ferrari, 2010 KPP. (Large, 1994) Closure Model. (Canuto, 2000) Parameterizations Employed in Models Vertical GGL90: TKE scheme ME: Meso-scale Eddies scheme Horizontal Comments POP2 Const, Ri, KPP Smagorinsky, GM, Aniso. CESM, CCSM MOM4 PP,KPP Smagorinsky , Aniso., ME* GFDL TIMCOM PP PP DIECAST, CANDIE MITgcm KPP, GGL90*, Bulk GM/Redi POM MY Smagorinsky MICOM ROMS Mellor. Isopycnal KPP, MY Regional Model Sheng, et al., 1998 (CANDIE) Brief Summary • Horizontal diffusivity often larger than vertical diffusivity. • Vertical diffusivity varies with different depth or regions containing complicated physical process. • Advanced-technologies, such as Satellite, offer more information about estimation on diffusivity. • Parameterized model helps us to understand mixing process as well as ocean currents. Thank You Model Simulation Levitus KPP. (Large, 1994) Model Closure Model. (Canuto, 2000) Brief Summary • Computational cost drops by using of new equation of state. • At deep ocean where temperature and salinity change slightly, the local linear fit (linear) is adequate, and has the computational advantage. • Near surface nonlinear local equation (nonlinear 2) enables accurate density over a wide range of temperature and salinity, like coastal regions • For surface water away from coastal area where salinity doesn’t change a lot, but temperature still varies, nonlinear local equation (nonlinear) might be useful.


