Earthquake Engineering: Housner Spectrum
advertisement
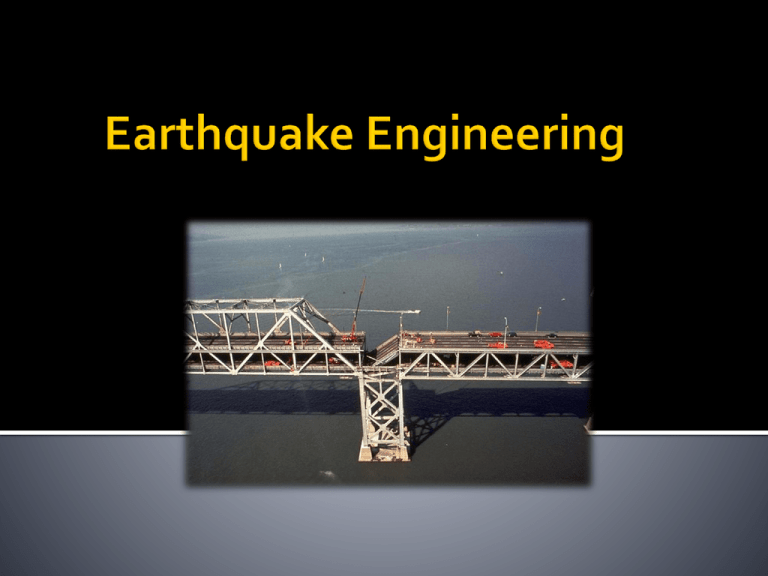
Airport, Sendai, Japan Fukushima-Daichi nuclear power plant SENDAI, JAPAN (8.9 MAGNITUDE) http://earthquake.usgs.gov/eqcenter/recenteqsww/ HISTORICAL SEISMICITY MAP http://earthquake.usgs.gov/earthquakes/world/seismicity_maps/world.pdf http://www.mapsofworld.com/world-major-earthquake.htm Some Major Earthquakes, Past and Present •Christchurch, NZ 2011 •Talca, Chile 2010 •Port-au-Prince, Haiti, 2010 •Guandong, China, 2008 •Fukuoka, Japan, 2005 •Izmit, Turkey, 1999 •Northridge, CA, 1994 •Mexico City, 1985 Amazing engineering: Buildings Sway Without Collapsing Different model parameters Can we predict how different buildings will respond to an earthquake? How can we use this information to engineer a safe structure Tabas 1978 Ground Acceleration (Fault Normal) 1 0.8 0.6 Accel. (units of g) 0.4 0.2 0 -0.2 -0.4 -0.6 -0.8 0 5 10 15 20 25 30 35 Time (s) Acceleration record is messy. No way to integrate Duhamel’s integral. No worries, computers to the rescue! Relative motion of building and ground Measured Acceleration/USGS data Impulse Response Function Tabas 1978 Ground Acceleration (Fault Normal) Ground acceleration (units of g) Accel. (units of g) 1 0.8 0.6 0.4 0.2 0 -0.2 -0.4 -0.6 -0.8 0 5 10 15 20 25 30 35 Time (s) Tabas 1978: Relative Displacement: o = 1 0.15 z(t) Z(t) meters 0.1 z = 0.05 is assumed 0.05 0 -0.05 -0.1 -0.15 -0.2 0 5 10 15 20 25 30 35 Time (s) marks |z|max Tabas 1978: Relative Displacement: o = 3 0.06 z(t) Z(t) meters 0.04 0.02 0 -0.02 -0.04 -0.06 0 5 10 15 20 25 30 35 30 35 Time (s) Tabas 1978: Relative Displacement: o = 10 0.01 0.005 z(t) Z(t) meters 0.015 0 -0.005 -0.01 0 5 10 15 20 Time (s) 25 If we found |z|max for a continuous range of o, we’d get the Spectral Displacement (Displacement Spectrum) Spectra For El Centro Ground Motion Velocity Acceleration Displacement Natural Period (sec) Figure Credits: L A Chopra, Dynamics of Structures, Chap 6 Right: G. Housner “Strong Ground Motion” in Earthquake Engineering, R Wiegel, editor. Averaged Spectra To Many (88) Earthquakes Tripartite Representation SD = spectral displacement SV = spectral velocity SA = spectral acceleration SA /o = SV = oSD Spectrum for one earthquake Spectrum averaged over 88 earthquakes Seattle, WA is a beautiful city, but is prone to large earthquakes. The monorail on the bridge has previously been measured to have a natural period of 2 s. Damping is assumed to be 2%. During an earthquake, is the trolley likely to derail? Use the Housner spectrum to find out! Picture from: http://bcostin.wordpress.com/2008/02/25/seattle-worlds-fair-1962-postcards/seattle-monorail/ You are hired as an architectural engineer to build a California dream house on a hillside. The structure can be idealized as shown (on chalkboard). The frame is built out of concrete (E = 30x109 Pa). The support columns have a cross section of 10 inches squared. Assume damping is 5%. Determine the base shear in each column, which is more likely to fail? BUCKLING SMASHING/POUNDING Figure credit: Michael D. Symans, PhD Rensselaer Polytechnic Institute: http://www.nibs.org/client/assets/files/bssc/Topic15-7-SeismicIsolation.pdf CONVENTIONAL BUILDING BASE-ISOLATED BUILDING Figure credit: Michael D. Symans, PhD Rensselaer Polytechnic Institute: http://www.nibs.org/client/assets/files/bssc/Topic15-7-SeismicIsolation.pdf Shear Modulus E ~ 0.5 – 1.0 MPa Figure credit:s Michael D. Symans, Rensselaer Polytechnic Institute: http://c.ymcdn.com/sites/www.nibs.org/resource/resmgr/BSSC/Topic15-7-SeismicIsolation.pdf Reduces shearing in columns…………but increases displacement Rubber Base Isolators UCSD testing facility LBRs in Japan Displacement , u Image credit: http://www.asee.org/documents/sections/pacificsouthwest/2008/Porbaha_Ali_et_al%20Base%20isolation.pdf Image credits: http://www.asee.org/documents/sections/pacific-southwest/2008/Porbaha_Ali_et_al%20Base%20isolation.pdf http://nees.buffalo.edu/docs/dec304/FP-DC%20Report-DEMO.pdf; laconservancy.org Restoring/Recentering Force Frictional Force Pendulum Period: T= 2𝜋 𝑅/𝑔 Restoring/Recentering Force Frictional Force


