acquisition rates effect on multiparametric rare
advertisement
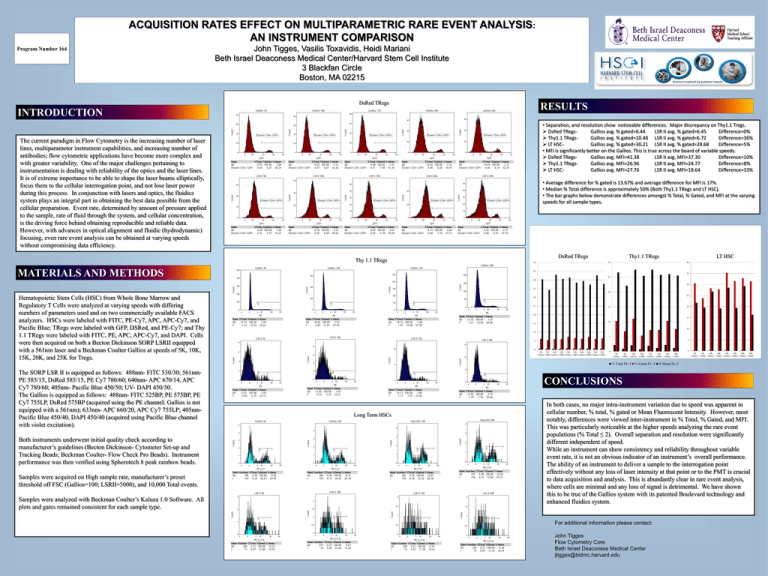
ACQUISITION RATES EFFECT ON MULTIPARAMETRIC RARE EVENT ANALYSIS: AN INSTRUMENT COMPARISON Program Number 164 John Tigges, Vasilis Toxavidis, Heidi Mariani Beth Israel Deaconess Medical Center/Harvard Stem Cell Institute 3 Blackfan Circle Boston, MA 02215 DsRed TRegs RESULTS INTRODUCTION • Separation, and resolution show noticeable differences. Major discrepancy on Thy1.1 Tregs. DsRed TRegsGallios avg. % gated=6.44 LSR II avg. % gated=6.45 Difference=0% Thy1.1 TRegsGallios avg. % gated=10.48 LSR II avg. % gated=6.72 Difference=36% LT HSCGallios avg. % gated=30.21 LSR II avg. % gated=28.68 Difference=5% • MFI is significantly better on the Gallios. This is true across the board of variable speeds. DsRed TRegsGallios avg. MFI=41.38 LSR II avg. MFI=37.30 Difference=10% Thy1.1 TRegsGallios avg. MFI=26.96 LSR II avg. MFI=24.77 Difference=8% LT HSCGallios avg. MFI=27.76 LSR II avg. MFI=18.64 Difference=33% The current paradigm in Flow Cytometry is the increasing number of laser lines, multiparameter instrument capabilities, and increasing number of antibodies; flow cytometric applications have become more complex and with greater variability. One of the major challenges pertaining to instrumentation is dealing with reliability of the optics and the laser lines. It is of extreme importance to be able to shape the laser beams elliptically, focus them to the cellular interrogation point, and not lose laser power during this process. In conjunction with lasers and optics, the fluidics system plays an integral part in obtaining the best data possible from the cellular preparation. Event rate, determined by amount of pressure applied to the sample, rate of fluid through the system, and cellular concentration, is the driving force behind obtaining reproducible and reliable data. However, with advances in optical alignment and fluidic (hydrodynamic) focusing, even rare event analysis can be obtained at varying speeds without compromising data efficiency. • Average difference for % gated is 13.67% and average difference for MFI is 17%. • Median % Total difference is approximately 50% (Both Thy1.1 TRegs and LT HSC). • The bar graphs below demonstrate differences amongst % Total, % Gated, and MFI at the varying speeds for all sample types. Thy 1.1 TRegs MATERIALS AND METHODS DsRed TRegs Thy1.1 TRegs LT HSC 30 50 40 45 35 25 40 30 35 20 Hematopoietic Stem Cells (HSC) from Whole Bone Marrow and Regulatory T Cells were analyzed at varying speeds with differing numbers of parameters used and on two commercially available FACS analyzers. HSCs were labeled with FITC, PE-Cy7, APC, APC-Cy7, and Pacific Blue; TRegs were labeled with GFP, DSRed, and PE-Cy7; and Thy 1.1 TRegs were labeled with FITC, PE, APC, APC-Cy7, and DAPI. Cells were then acquired on both a Becton Dickinson SORP LSRII equipped with a 561nm laser and a Beckman Coulter Gallios at speeds of 5K, 10K, 15K, 20K, and 25K for Tregs. 25 30 25 20 15 20 15 10 15 10 10 5 5 5 0 5K 5K 10K 10K 15K 15K 20K 20K 25K 25K Gallios LSRII Gallios LSRII Gallios LSRII Gallios LSRII Gallios LSRII 0 0 5K Gallios 5K LSRII 10K Gallios % Total FL-5 The SORP LSR II is equipped as follows: 488nm- FITC 530/30; 561nmPE 585/15, DsRed 585/15, PE Cy7 780/60; 640nm- APC 670/14, APC Cy7 780/60; 405nm- Pacific Blue 450/50; UV- DAPI 450/50. The Gallios is equipped as follows: 488nm- FITC 525BP, PE 575BP, PE Cy7 755LP, DsRed 575BP (acquired using the PE channel; Gallios is not equipped with a 561nm); 633nm- APC 660/20, APC Cy7 755LP; 405nmPacific Blue 450/40, DAPI 450/40 (acquired using Pacific Blue channel with violet excitation). Both instruments underwent initial quality check according to manufacturer’s guidelines (Becton Dickinson- Cytometer Set-up and Tracking Beads; Beckman Coulter- Flow Check Pro Beads). Instrument performance was then verified using Spherotech 8 peak rainbow beads. Samples were acquired on High sample rate, manufacturer’s preset threshold off FSC (Gallios=100; LSRII=5000), and 10,000 Total events. Samples were analyzed with Beckman Coulter’s Kaluza 1.0 Software. All plots and gates remained consistent for each sample type. 10K LSRII 15K Gallios % Gated FL-5 15K LSRII 20K Gallios 20K LSRII 5K 5K 10K 10K 15K 15K 20K 20K Gallios LSRII Gallios LSRII Gallios LSRII Gallios LSRII X-Mean FL-5 CONCLUSIONS Long Term HSCs In both cases, no major intra-instrument variation due to speed was apparent in cellular number, % total, % gated or Mean Fluorescent Intensity. However, most notably, differences were viewed inter-instrument in % Total, % Gated, and MFI. This was particularly noticeable at the higher speeds analyzing the rare event populations (% Total ≤ 2). Overall separation and resolution were significantly different independent of speed. While an instrument can show consistency and reliability throughout variable event rate, it is not an obvious indicator of an instrument’s overall performance. The ability of an instrument to deliver a sample to the interrogation point effectively without any loss of laser intensity at that point or to the PMT is crucial to data acquisition and analysis. This is abundantly clear in rare event analysis, where cells are minimal and any loss of signal is detrimental. We have shown this to be true of the Gallios system with its patented Boulevard technology and enhanced fluidics system. For additional information please contact: John Tigges Flow Cytometry Core Beth Israel Deaconess Medical Center jtigges@bidmc.harvard.edu
