ISRIC-GWC Introduction and WOCAT
advertisement
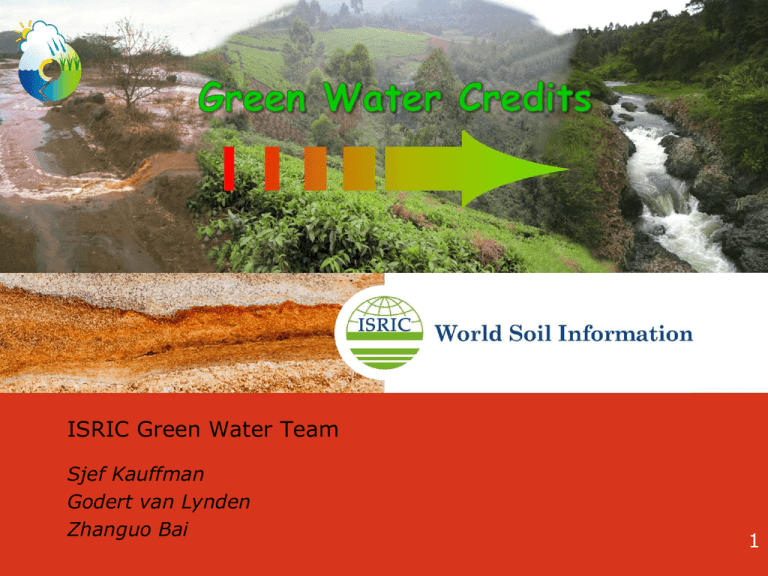
ISRIC Green Water Team Sjef Kauffman Godert van Lynden Zhanguo Bai 1 Water and Sustainable Land Management • • Instead of a narrow focus on surface and ground (“blue”) water alone, more attention is needed for the green water component: water in the soil available for plant growth; The green water component comprises at an average 2/3 of total rainfall (Falckenmark and Rockstrom, 2006); Starting points • • • • • Key resource is rain water Farmer can improve local water balance Upstream land management is linked to downstream water availability Farmers are key and need support to make investments How can we support the farmers? 3 More water cannot be created, but: Current land management practices show wasting of rain water by : • high rates of surface runoff enhancing flash floods and erosion, and • large losses by evaporation of water directly from bare soil (up to 60% of rainfall!) Blue water can be better managed by good soil & water management: • • • • reducing runoff and erosion, more infiltration, less unproductive evaporation, more water for plant growth Better soil and water management can also greatly increase water supply downstream and improve rural livelihoods 5 Farmers know the benefits from green water management, but need incentives to cover the costs/ labour Green Water Credits bridge the incentive gap: Compensation by water users to water providers for specified water management services 6 Targets/Potential benefits 7 Who and where are the key players? 8 4 Work Domains 1. Biophysical analysis 2. Socio-economic study 3. Institutional inventory 4. Financial Mechanism Estimated increase in hydro-power from green water management (50% cut in erosion/siltation) Hydropower Generation Scenario: upland_management, All months g b c d e f b c d e f g b c d e f g b c d e f g b c d e f g 200 180 160 Masinga Kindaruma Kiambere Kamburu Gitaru 140 120 100 000 GJ = 100 51 000 barrels oil 80 = $ 5.8 million 60 40 20 0 1989 1992 1995 1998 2001 2004 2007 2010 2013 2016 2019 2022 2025 2028 10 Green Water Credits (Algeria, China?, Ethiopia??, Burundi??) (Morocco) (Kenya) Phase I Proof-of-Concept/ Business Case Phase II Design and capacity building Phase III Implementation 11 Results Started 2006 Currently implemented in • Kenya, Upper Tana Basin (Phase II, till Sept. 2011: Project Design) • Morocco: Sebou Basin (Phase I, till Sept. 2011: Proof of Concept) • Algeria (Project preparation) • China, (Proposal) 12 Upper Tana, Kenya Sebou Basin, Morocco CHN43 Pits Quest CHN45 Terrace Id SWC Technology Name CHN47 Check Dam 160 measurements trees Measurements/ 160 measurements crop LGP Estimates PlantType 3.08 Soil Produc Prod Loss 2.7 108% 58 tion Diff% (t/ha) 180 estimates 3.5 10.34 Soil SoilLoss 122 68% LossDiff Diff% 2 Runoff (% of 4 rainfall) Runoff Runof 6 60% Diff Diff% 110 70 39% 30 18 38% WOCAT in GWC 77% 8 80% CHN49 Caragana Korshinskii Planting----a kind 160 estimates of SWC vegetative technology ETH01 Trashlines 90 estimates Stipa 3.375 bungeana mixed cereals 1.3 & pulses, cotton 75 95 56% 2 8 80% 10 90 90% 25 45 64% ETH04 Hillside Terracing 90 measurements 30 ETH11 Multiple Cropping 90 estimates grass/bush/tr 13 ee Sorghum 0.9 50% 10 40 80% KEN05 Fanya Juu Terrace 90 estimates maize 1.5 50% 2 9 82% 20 30 60% KEN10 Road runoff management - Nyeri 120 estimates 1.35 25% 15 10 40% 20 30 60% KEN11 Road runoff system - Mwingi 105 estimates all 1.5 2 10 83% 10 70 88% KEN15 double dug beds - Busia experience 120 measurements maize 2 150% 5 10 67% 40 KEN16 Grevillea tree planting as an 100 agroforestry intervention KEN22 Water Harvesting and Enlarged 90 Structures KEN22 Water Harvesting and Enlarged 90 Structures KEN22 Water Harvesting and Enlarged 90 Structures KEN22 Water Harvesting and Enlarged 90 Structures KEN23 Riverbed reclamation & silt trapping for 75 sugarcane KEN24 Gully Reclamation 60 estimates coffee 7.5 0% 3.5 1.5 30% 35 5 13% estimates maize 1.2 100% 0.8 7.2 90% 7 38 84% estimates beans 0.6 0.8 7 estimates sugarcane 5 0.8 7 estimates banana 3 0.8 7.2 90% 7 38 84% estimates sugarcane 5 5 7 58% 20 40 67% estimates banana 4 0.6 609.4 100% 10 50 83% KEN24 Gully Reclamation 60 estimates pawpaw 8 0.6 10 KEN24 Gully Reclamation 60 estimates grass 0.6 10 KEN25 Pasture Mangt. through Removal of comiphora KEN26 Water Table Management 70 estimates comiphora 1 70 estimates sugarcane KEN27 Gully blocking by stone checks 120 estimates fruit trees KEN30 Conservation Tillage through ripping 120 estimates wheat 6 2.7 2 67% 8 12 60% 100% 0.5 1 67% 4 4 50% 0.5 5 91% 10 40 80% 20 30 60% 80% 0 Examples from WOCAT database (> 350 technologies worldwide) CONCLUSIONS • GWC is a financial facility to support farmers in soil and water conservation activities: 1. For initial investments (short term) 2. For maintenance investments (long term) in appropriate green water management 3. Where downstream water users compensate farmers upstream for the benefits derived from appropriate soil and water management 22 More information... www.isric.org www.greenwatercredits.net www.wocat.net Godert.vanlynden@wur.nl Sjef.Kauffman@wur.nl Zhanguo.Bai@wur.nl
