Initiative 1
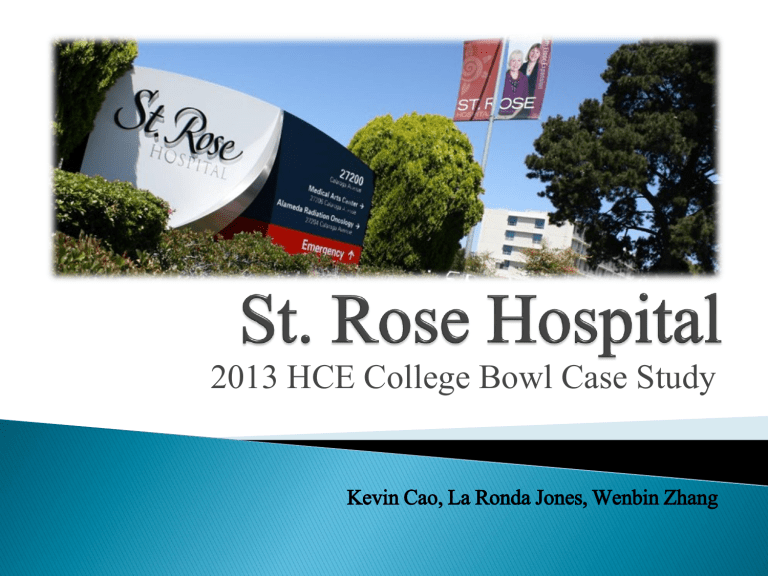
2013 HCE College Bowl Case Study
Kevin Cao, La Ronda Jones, Wenbin Zhang
As the CEO’s of Alecto Healthcare Services, we must address the following issues in managing St. Rose
Hospital
◦ Financial hardship
◦ Addressing provisions of the Patient Protection and
Affordable Care Act
2,5
2
2,21
1,69
1,5
1
0,93
0,5
1,07
0,81
0
2007 2008 2009 2010 2011 2012
0,36
Current Ratio
$10 000
$5 000
$0
($5 000)
($10 000)
($15 000)
($20 000)
($25 000)
($2 361)
($3 049)
$5 850
($390)
($7 074)
Net Income
Alecto Audit
Present
($23 371)
2007 2008 2009 2010 2011 2012
*Numbers in Thousands
* See calculation in Appendix
$10 000
$5 000
$0
($5 000)
($10 000)
($2 361)
($3 049)
$5 850
($390)
($15 000)
($20 000)
($25 000)
($7 074)
($23 371)
($14 143)
($16 736)
($19 330)
($21 923)
Net Income
Alecto Audit
Projected
* Numbers in Thousands
* See calculation in Appendix
Healthcare Exchange
Medicaid Expansion
Initiative 1
• Revamping Financial Outputs
Initiative 2
• Patient Inreach Program
Revamping Financial Outputs
In order to reduce costs we must restructure our expenditures to remain financially viable for the future
◦ Reducing Community Benefit Service Expenses
◦ Addressing the suspended SNF Unit Beds
◦ Administrative Services Budget Cut
The Skilled Nursing Facility was closed and the beds were put in suspense as a reaction to the financial losses incurred
We recommend the continued suspense and closure of the Skilled Nursing Beds due to reduced SNF reimbursement rates from CMS
There are over 10 Long Term Care facilities located in the Health Service Area of SRH
Currently, this program costs the hospital over
$290,000 each year in volunteer hours
◦ While we recognize the significance of this program, cuts across the board are required for financial survivability
$600 000
$500 000
$400 000
$300 000
$200 000
$100 000
$0
2007 2008 2009 2010 2011
$61,000 Decrease in
Expenses
Integrated Nurse
Leadership Program
INLP reduced 25%
Total Community Benefit
Services
Total with 25% reduction
The Tattoo Removal Program involves 30 participants
With a goal of adding 5 additional participants every year, the hospital will incur an additional $76,500 in expenses over 5 years
We recommend that the program continue with a maximum of 30 participants for an interim period to reduce the amount of excess costs
$60 000
$50 000
$40 000
$30 000
$20 000
$10 000
$0
$56 100
$51 000
$45 900
$40 800
$35 700
$25,000
Increase in expenses
Tattoo Removal Day
Projected with 5 additional participants a year
Tattoo Removal Day
Projected with 30 participants
* See calculation in Appendix
Our management team will keep administrative costs down to 6.5% of our total expenses from the previous year
◦ This will help us keep our total expenses down from year to year in an effort to implement new programs that will positively affect patient care
25 000 000
20 000 000
15 000 000
10 000 000
5 000 000
0
$20 521 142
An $8 Million reduction in
Administrative
Expenses
12 498 858
Admin Services
Expense at
6.5% of total
Expenses
Admin Services
Expense without
Intervention
*See calculation in Appendix
*Source: OSHPD HAFD
Patient Inreach Service Implementation
Patient Inreach Service
Receive Staff Training
Patient Education,
Enrollment and Retention
Target
Population 1
Increased Patient Volume
Increased Service Quality and
Patient Value
Increased Revenue
Target
Population 2
Benefit
Enrollment
Program
• Approved Staff to
Training/Interpreter
Services
• Patient Assessment
• Patient Enrollment
Assistance
Educate
Enroll
Retain
Covered California supports consumers benefit training through a Benefit Assister Training program
Employees selected for training
◦ Inpatient Services will utilize Discharge Planners and
Social Workers for enrollment
◦ Outpatient Clinic Services will utilize the business office staff for enrollment
◦ All St. Rose Certified Interpreters
With a total of 22, 289 uninsured patients in Hayward
32.5% are not proficient in English
At no additional cost St. Rose Hospital can enroll current employees who are interpreters in the program for training which will be vital for our non-
English speaking patient population
*Source:US Census Bureau, American Community Survey, 2008
Utilizing our EHR for the enrollment process
Capturing enrollment opportunities 24 hours around the clock
This flowchart will explain in detail the patient discharge process for the benefit enrollment program and patient follow up to decrease Medicare 30 day readmissions
Physician orders
Discharge
YES
Proceed with discharge collect insurance
Notification to
Staff
Assist patient with submission
Visits patient in ED or follow-ups within
72 hours
Educate patient about Covered
California
Patient is then matched and enrolled
Educate about benefits of the selected program
Determine
Eligibility
NO
Continue with discharge process
Patient goes home
Patient Follow Up
Call Post-
Discharge
Indigent; 5,9
Other; 1,8
Target Group
Medicare Traditional
35.1
Medi-Cal Traditional
24.8
Medi-Cal Managed
14.1
Medicare Managed
Care; 4
Third Party
Traditional; 1,1
Third Party Managed
Care, 13.2
*Other include self-pay, workers* compensation, other government, and other payers
Source: OSHPD Financial Disclosure Report, FY 2011 (based on inpatient discharges)
21 Million uninsured in 18-34 age group
Projected decrease of the 42% of uninsured currently existing between the ages of 18-65 due to Covered
California enrollment
15
10
5
0
25
20
22,5
11,6
10,6
Target Population
Percentage of Uninsured in
Alameda County in 2010 for Age Group
18-24 25-39
Age Group
40-64
*Source: County of Alameda
Streamline Eligibility and Enrollment Process for
Potential Medi-Cal Patients
It requires that states make DSH payments to hospitals treating large numbers of low-income patients because:
◦ Low-income patients are more likely to be uninsured or
Medicaid enrollees.
◦ Uncompensated Care
◦ Low Medicaid Payment Rate
*Mitchell 2012
$4,5
$4,0
$3,5
$3,0
$2,5
$2,0
$1,5
$1,0
$0,5
$0,0
2006 2007 2008
DSH Funds Received
2012
0
10
5
25
20
15
2009 2010 2011
Adjusted Medi-Cal Patient Days
*Source: OSHPD HAFD
( Middle Class Tax Relief and
Job Creation Act of 2012 )
*Mitchell 2012
0,7
0,7
0,7
0,7
0,7
0,7
0,7
0,8
0,7
0,7
Less than 100 % FPL
100-138 % FPL
2014
690 000
720 000
2016
700 000
730 000
2019
720 000
740 000
*Lucia & etc. 2013
Lack of awareness of Medi-Cal
Lack of awareness of eligibility standards
Dislike of the program
Belief that they are insured
Paperwork is too difficult
*Lucia & etc. 2013
1,0
0,9
0,8
0,7
0,6
0,5
0,4
0,3
0,2
0,1
0,0
Base Scenario
Enhanced Scenario
2014
480 000
780 000
2016
630 000
880 000
2019
750 000
910 000
*Lucia & etc. 2013
10
9
8
-
2
1
7
6
5
4
3
Base Scenario
Enhanced Scenario
2014
4 608
7 488
2016
6 048
8 448
2019
7 200
8 736
*See calculation in Appendix
$6
$5
$4
$3
$2
$1
$0
2014
Base Scenario $2 915 113
Enhanced Scenario $4 737 059
2016
$3 826 086
$5 344 374
2019
$4 554 864
$5 526 568
*See calculation in Appendix
$180
$170
$160
$150
$140
$130
Net Patient Revenue with newly Enrolled MediCal
Patients
Net Patient Revenue
$120
$110
2011 2012 2013 2014 2015 2016
*Source: OSHPD HAFD
Initiative 1
• Revamping Financial Outputs
Initiative 2
• Patient Inreach Program
Our findings indicate that the current state of St. Rose is undesirable
Without intervention the hospital would not be financially viable for the future
Our recommendation is for a two step initiative that places the hospital in a better position
Alameda County. (2013). Preparing for 2014 ACA implementation. Retrieved from http://achealthcare.org/wp-content/uploads/2013/03/Eligibility-Enrollment-Maps-Presentation-
2.11.13.pdf
California Health Benefit Exchange. (2013). Covered California. Retrieved from http://www.coveredca.com/about_us.html
California State Office of Statewide Health Planning & Development. (2007-2011). Healthcare
Information Division. Retrieved from http://www.oshpd.ca.gov/HID/DataFlow/HospMain.html
Eden Youth & Family Center. (2012). New Start Tattoo Removal Program. Eden Youth & Family
Center. Retrieved from http://www.eyfconline.org/programs/new-start-tattoo-removal-program/
Flex Monitoring Team. (2012). Why Do Some Critical Access Hospitals Close Their Skilled Nursing
Facility Services While Others Retain Them? Flex Monitoring Team. Retrieved from http://flexmonitoring.org/documents/Briefing%20Paper32-CAH-SNF
Lucia, L. Jacobs, K. Watson, G. Dietz, M. Roby, D. H. (2013). Medi-Cal Expansion under the Affordable
Care Act: Significant Increase in Coverage with Minimal Cost to the State. UC Berkeley Center for
Labor Research and Education. UCLA Center for Health Policy Research. Retrieved from http://laborcenter.berkeley.edu/healthcare/medi-cal_expansion.shtml
Medical Development Specialist, LLC. (2012) Effect of Alecto Healthcare Services Hayward LLC’s
Management and Acquisition of Rose Hospital in the Availability or Accessibility of
Healthcare Services. Retrieved from http://oag.ca.gov/sites/all/files/agweb/pdfs/charities/pdf/srh_health_impact.pdf
Mitchell, A. (2012). Medicaid Disproportionate Share Hospital Payments. Congressional Research
Service. Retrieved from https://www.fas.org/sgp/crs/misc/R42865.pdf
Moore Foundation. (2013). Betty Irene Moore Nursing Initiative. Gordan and Betty Moore
Foundation. Retrieved from http://www.moore.org/nursing.aspx
OSHPD Hospital Annual Financial Data Pivot Table 2007-2011. Retrieved from http://www.oshpd.ca.gov/HID/Products/Hospitals/AnnFinanData/PivotProfles/default.
Asp
Preliminary Medi-Cal Enrollment by Zip Code Pivot Table. Retrieved from http://www.dhcs.ca.gov/dataandstats/statistics/Pages/Medi-
Cal%20Enrollment%20by%20Zip%20Code.aspx
United States Department of Health and Human Services. (2012). Initial Guidance to State on
Exchanges. Retrieved from http://www.healthcare.gov/law/resources/regulations/guidanceto-states-on-exchanges.html
U.S. Department of Commerce United States Census Bureau. (2008) Retrieved by http://www.census.gov/acs/www/data_documentation/2008_release/
Net Income Audit
Net Operating Revenue
Operating Expense
Net from Operations
Net Non Operating Rev.
Extraordinary Items
Net Income
2007 2008 2009 2010 2011 2012 2013 2014 2015 2016
$118,445 $128,931 $142,322 $147,013 $160,444 $136,070 $157,606 $162,959 $168,312 $173,665
$117,898 $128,501 $141,234 $146,565 $180,413 $143,275 $171,776 $180,003 $188,231 $196,458
$547 $430 $1,088 $448 ($19,969) ($7,205) ($14,170) ($14,129) ($16,548) ($18,966)
$115 $61 $1,787 $188 ($84) $131 $171 $115 $59 $3
($3,023) ($3,540) $2,975 ($1,026) ($3,318) $0 ($144) $193 $529 $866
($2,361) ($3,049) $5,850 ($390) ($23,371) ($7,074) ($13,855) ($14,207) ($17,018) ($19,829)
Integrated Nurse Leadership Program
Total Community Benefit Services without INLP
INLP reduced 25%
Total with 25% reduction
INLP Reduced 50%
Total with 50% reduction
$80,000 $280,000 $280,000 $290,000 $290,000
$170,910 $224,935 $215,495 $253,160 $267,070
$60,000 $210,000 $210,000 $217,500 $217,500
$230,910 $434,935 $425,495 $470,660 $484,570
$40,000 $140,000 $140,000 $145,000 $145,000
$210,910 $364,935 $355,495 $398,160 $412,070
Tattoo Removal Day Projected with 5 additional participants a year $30,600 $30,600 $30,600 $30,600 $30,600 $35,700 $40,800 $40,800 $40,800 $40,800
Tattoo Removal Day Projected with 30 participants $30,600 $30,600 $30,600 $30,600 $30,600 $30,600 $30,600 $30,600 $30,600 $30,600
2007 2008 2009 2010 2011 2012 2013 2014 2015 2016
Admin Services Expense without
Intervention
$8,132,3
66
$9,538,8
77
$12,133,
070
$12,296, $13,472,2
979 03
$15,146, $16,489,80 $17,833,58 $19,177,36 $20,521,14
032 9 7 5 2
Admin Services Expense at 6.5% of total
Expenses
8,132,36
6
9,538,87
7
12,133,0
70
12,296,9 13,472,20
79 3
9,794,30
6 10,305,092 11,036,347 11,767,603 12,498,858
102,241,
023
115,181,
914
125,041,
938
130,801,
150,681,6
560 28
158,539, 169,789,95 181,040,04 192,290,12 203,540,21
869 5 1 6 2 Total Expenses
Admin Svcs % of tot. Expenses With
Intervention @6.5% 7.95% 8.28% 9.70% 9.40% 8.94% 6.50% 6.50% 6.50% 6.50% 6.50%
In 2011, SRH service area has 74,981Medi-Cal beneficiaries(page 37).
In 2011, there are 7,790,828 total Medi-Cal beneficiaries in CA (Preliminary Medi-Cal
Enrollment by Zip Code Pivot Table).
The ratio is 74981/7790828 = 0.96%
Thus, the increase of new eligible enrollment in SRH service area will be:
0.96% x California number of increase
For example:
In 2014, there will be 0.96% x 480,000 = 4608 newly eligible enrollment in SRH service area under base scenario.
In 2011, SRH Net Patient Revenue from Medi-Cal was $47,434,200 (OSHPD HAFD Pivot
Table 2011)
In 2011, SRH service area had 74,981Medi-Cal beneficiaries (page 37).
The ratio is 47434200/74981 = 632.62 dollars/ beneficiary
The potential increase in Medi-Cal net patient revenue is:
632.62 dollars/ beneficiary x number of newly enrolled
For example: the number for 2014 under base scenario will be:
632.62 dollars/ beneficiaries x 4608 = $2,915,113


