transparencies
advertisement
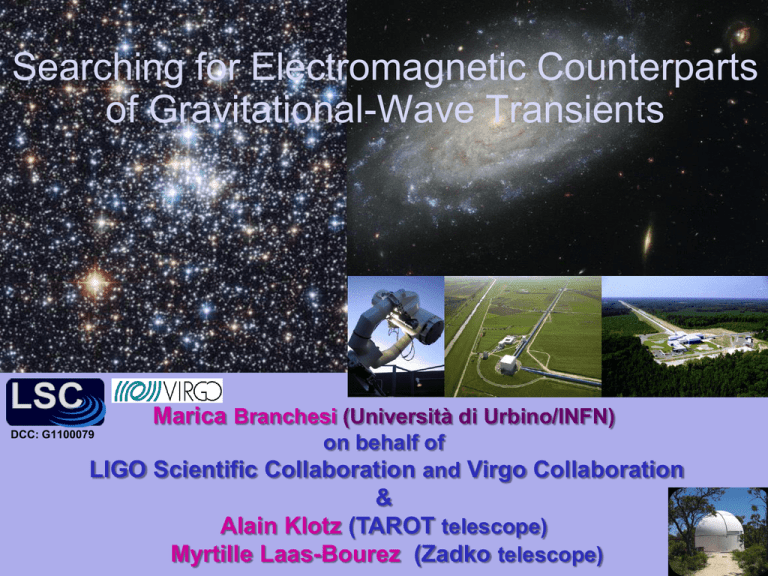
Searching for Electromagnetic Counterparts of Gravitational-Wave Transients Marica Branchesi (Università di Urbino/INFN) DCC: G1100079 on behalf of LIGO Scientific Collaboration and Virgo Collaboration & Alain Klotz (TAROT telescope) Myrtille Laas-Bourez (Zadko telescope) A goal of LIGO and Virgo interferometers is the first direct detection of gravitational waves from ENERGETIC ASTROPHYSICAL events: Mergers of NeutronStars and/or BlackHoles SHORT GRB Kilonovas Core Collapse of Massive Stars Supernovae LONG GRB Cosmic String Cusps EM burst Main motivations for joint GW/EM observations: Increase the GW detection confidence; Get a precise (arcsecond) localization, identify host galaxy; Provide insight into the progenitor physics; In the long term start a joint GW/EM cosmology. 1 Low-latency GW data analysis pipelines allow the use of GW triggers in real time to obtain prompt EM observations and to search for EM counterparts The first program of EM follow-up to GW candidates has been performed during two LIGO/Virgo observing periods: Dec 17 2009 to Jan 8 2010 – Winter Run Sep 4 to Oct 20 2010 – Summer Run The EM-follow-up program in S6-VSR2/3 is a milestone towards advanced detectors era where the chances of GW detections are very enhanced Presentation Highlights: Methods followed to obtain low-latency Target of Opportunity EM follow-up observations; Development of image analysis procedures able to identify the EM counterparts. 2 GW Online Analysis H1 L1 Omega & cWB for Unmodeled Bursts V1 MBTA for signals from Compact Binary Coalescence • LIGO (H1 and L1) and Virgo (V1) interferometers • Search algorithms to identify triggers GRACE DB ARCHIVE LUMIN for Optical Telescopes GEM for Swift • Select Statistically Significant Triggers • Determine Pointing Locations 10 min. Event Validation 30 min. Send alert to telescope 3 Requirements to select a trigger as a candidate for the EM follow-up: • Triple coincidence among the three detectors; • Power above a threshold estimated from the distribution of background events: Target False Alarm Rate Winter Run < 1.00 event per Day Summer Run < 0.25 event per Day for most of optical facilities < 0.10 event per Day for PTF and Swift GW Source Sky Localization: signals near threshold localized to regions of tens of square degrees possibly in several disconnected patches Necessity of wide field of view telescopes LIGO/Virgo horizon: a stellarmass BH/ NS binary inspiral detected out to 50 Mpc distance that includes thousands of galaxies GW observable sources are likely to be extragalactic Limit regions to observe to Globular Clusters and Galaxies within 50 Mpc (GWGC catalog White et al. 2011) 4 Nearby galaxies and globular clusters (< 50 Mpc) are weighted to select the most probable host of a GW trigger: Mass * Likelihood P= Distance • Likelihood based on GW data • Mass and Distance of the galaxy or the globular cluster Probability Skymap for a simulated GW event • Black crosses nearby galaxies locations • Rectangles pointing telescope fields chosen to maximize chance to detect the EM counterpart 5 The expected EM counterpart afterglows guide observation schedule time SHORT/HARD GRB Compact Object mergers KILONOVAS Radioactively Powered EM-transient Luminosity (ergs s-1) R magnitude assuming z=1 R magnitude assuming z=1 LONG/SOFT GRB Massive star Progenitors Metzger et al.(2010), MNRAS, 406..265 Time (Days) Time (days after burst in the observer frame) Kann et arXiv:0804.1959 Time (days after burst in the observer frame) Kann et al. 2010, ApJ, 720.1513 Metzger et al.(2010), MNRAS, 406..265 Observed on-axis LONG and SHORT GRB afterglows peak few minutes after the EM/GW prompt emission EM observations as soon as possible after the GW trigger validation Kilonova model afterglow peaks about a day after the GW event EM observations a day after the GW trigger validation To discriminate the possible EM counterpart from contaminating transients repeated observations over several nights to study the light curve 6 Ground-based and space EM facilities observing the sky at Optical, X-ray and Radio wavelengths involved in the follow-up program Winter/Summer Run Only Summer Run Optical Telescopes X-ray and UV/Optical Telescope TAROT SOUTH/NORTH SkyMapper 1.86° X 1.86° FOV 5.6 square degree FOV Swift Satellite 0.4° X 0.4° FOV Zadko Pi of the Sky 25 X 25 arcmin FOV 20° X 20° FOV ROTSE Palomar Transient Factory 1.85 ° X 1.85° FOV 7.8 square degree FOV LOFAR Liverpool telescope 10 – 250 MHz QUEST 9.4 square degree FOV Radio Interferometer 4.6 X 4.6 arcmin FOV 7 Observations Performed with Optical Telescopes: Winter run 8 candidate GW triggers, 4 observed by telescopes Summer run 6 candidate GW triggers, 4 observed by telescopes Analysis Procedure for Wide Field Optical Images Limited Sky localization of GW interferometers Wide field of view optical images Requires to develop specific methods to detect the Optical Transient Counterpart of the GW trigger 8 LIGO/Virgo collaborations are actually testing and developing several Image Analysis Techniques based on: • Image Subtraction Methods (for Palomar Transient Factory, ROTSE and SkyMapper) • Catalog Cross-Check Methods (for TAROT, Zadko, QUEST and Pi of the Sky) The rest of the talk focuses on a Catalog-based Detection Pipeline under development for TAROT and Zadko: methodology and preliminary results obtained using images with simulated transients 9 Catalog-based Detection Pipeline for images taken by TAROT and Zadko telescopes TAROT South/North Zadko • 0.25 meter telescope • FOV 1.86° X 1.86° • Single Field Observation of 180 s exposure • Red limiting magnitude of 17.5 Afterglow Light Curves (source distance d=50 Mpc) LONG GRB Apparent Red magnitude “Afterglow light curves” for LONG/SHORT and Kilonova transients at a distance of 50 Mpc • 1 meter telescope • FOV 25 X 25 arcmin • Five Fields Observation of 120 s exposure • Red limiting magnitude of 20.5 SHORT GRB KILONOVA TAROT limiting magnitude Zadko limiting magnitude Time (days) 10 Catalog-based Detection Pipeline to identify the Optical Counterparts in TAROT and Zadko images Octave Code detect sources in each image avoid problems at image edges select central part of the image select “unknown objects” (not in USNO2A) Magnitude consistency to recover possible transients that overlap with known galaxies/stars SExtractor to build catalog of all the objects visible in each image FOV restricted to region with radius = 0.8 deg for TAROT and 0.19 deg for Zadko Match Algorithm (Valdes et al 1995; Droege et al 2006) to identify “known stars” in USNO2A (catalog of 5 billion stars down to R ≈ 19 mag) Recover from the list of “known objects”: |USNO_mag – TAROT_mag| > 4σ 11 …..Catalog-based Detection Pipeline reject cosmic rays, noise, asteroids... search for objects in common to several images reject background events select objects in “on-source” reject “contaminating objects” (galaxy, variable stars, false transients..) Spatial cross-positional check with match-radius of 10 arcsec for TAROT and 2 arcsec for Zadko chosen on the basis of position uncertainties “On-source region” = regions occupied by Globular Clusters and Galaxies up to 50 Mpc (GWGC catalog, White et al 2011) “Light curve” analysis Possible Optical counterparts 12 “Light curve” analysis - cut based on the expected luminosity dimming of the EM counterparts recall magnitude α [-2.5 log10 (Luminosity)] expect Luminosity α [time- β] magnitude α [2.5 slope index = measurement of (2.5 β) β log10(time)] to discriminate expected light curve from “contaminating events” The expected slope index for SHORT/LONG GRB is around 2.7 and kilonova is around 3 Initial Red magnitude ADU counts Slope Index Distance in Mpc Saturation effects saturated not saturated Red magnitude Coloured points = Optical LGRB Transients Black squares = contaminating objects Optical counterparts the ones with slope index > 0.5 Contaminating objects that could pass the cut are only variable AGN or Cepheid stars 13 Image characterization - limiting magnitude used a set of 10 test TAROT images (180 sec exposure) limiting magnitude of 15.5 for all images x + Integral Source Counts TAROT image counts USNOA counts Limiting magnitude R magnitude Counts(<mag)/sq degree Counts(0.5 mag bin)/sq degree Differential Source Counts x + TAROT image counts USNOA counts Limiting magnitude R magnitude Image Limiting Magnitude: point where Differential/Integral Source Counts distribution (vs magnitude) bends and moves away from the power law of the reference USNOA 14 Preliminary tests on sensitivity : obtained by running the Detection Pipeline over images with injections of Fake Transients Monte Carlo simulations at the Computing Center in Lyon: Injections of fake transients modelled using on-axis GRB and Kilonova afterglow light curves Time origin (time of GW trigger) set 1 day before the first image SHORT/HARD GRB LONG/SOFT GRB SGRB, LGRB intrinsic luminosity range parametrized by a magnitude offset 0 ÷ 8 SGRB, LGRB: random offset 0 ÷ 8 SGRB0, LGRB0: offset set to 0 SGRB8,LGRB8: offset set to 8 Efficiency Efficiency Distance (Mpc) kilonova LGRB LGRB0 LGRB8 Efficiency SGRB SGRB0 SGRB8 Kilonova Objects Distance (Mpc) Distance (Mpc) Preliminary results on Distance_50% horizon (Mpc): SGRB SGRB0 SGRB8 LGRB LGRB0 LGRB8 Kilonova 15 100 -----400 2500 80 10 Simulations using different sets of images and different time schedule wrt the GW trigger give similar results 15 Conclusions: The first EM follow-ups to GW candidates have been performed by the LIGO/Virgo community in association with several Partner EM Observatories “EM counterpart Detection pipelines” based on different analysis techniques are under test and development Preliminary results suggest that “Catalog-based Detection Pipeline” is able to detect on-axis GRB and Kilonova afterglows for TAROT and Zadko images Efforts are in progress to improve the efficiency and to extend the use to other telescope images The analysis of the images observed during the Winter/Summer LIGO/Virgo run is on-going

