Presentation
advertisement
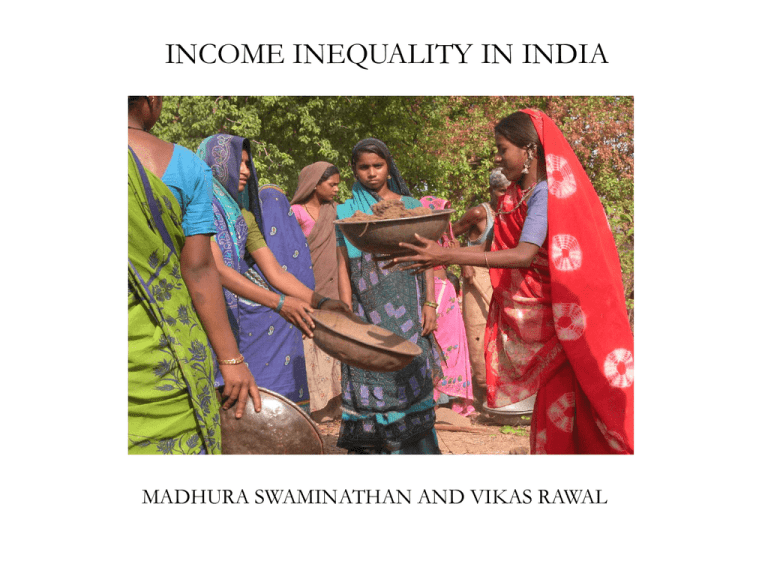
INCOME INEQUALITY IN INDIA MADHURA SWAMINATHAN AND VIKAS RAWAL • There is an impression – both within India and outside – that India is a country of relatively low income inequality. • India’s Gini index more favourable that those of comparable countries like South Africa, Brazil … China, and even the USA, which are otherwise ranked very high in human development. • • • • • India 36.8 South Africa 57.8 Brazil 55 China 41.5 USA 40.8 Source: HDR 2010 cited in Economic Survey 2010-2011 • Income versus expenditure inequality • Comparing non-comparables, like tea and rice • Inequality in expenditure less than inequality in incomes • Savings of rich households • Expenditure of poor households (dis-saving) • Levels versus trends INCOME DATA FROM NCAER • National Council for Applied Economic Research (NCAER) • 1993: covered 16 States and 35,130 households • 2005: covered all States and 26,734 rural households and 14,820 urban households • Estimates of income inaccurate • Aggregated (recall problems) • Non-standardised questions • Consistency across households • Gini for rural incomes was 0.46 in 1993-94 and 0.50 in 2004-05 (Azam and Shariff 2009) • Gini for rural incomes was 0.54 in 2004-05 (Vanneman and Dubey 2010) VILLAGES SURVEYED IN 2006 AND 2007 Table 1 Location of survey villages VILLAGE DISTRICT STATE AGROECOLOGICAL TYPE ANANTHAVARAM GUNTUR ANDHRA PRADESH PADDY DOMINATED AREA ANANTAPUR ANDHRA PRADESH DRY AND DROUGHT PRONE, GROUNDNUT AREA KARIMNAGAR ANDHRA PRADESH GROUND WATER IRRIGATED, MULTI-CROP HAREVLI BIJNOR UTTAR PRADESH 100% CANAL IRRIGATED, WITH GROUND WATER, WHEATSUGARCANE MAHATWAR BALLIA UTTAR PRADESH GROUND WATER IRRIGATED, WHEAT PADDY ROTATION WARWAT KHANDERAO BULDHANA MAHARASHTRA UN-IRRIGATED, COTTON REGION NIMSHIRGAON KOLHAPUR MAHARASHTRA IRRIGATED SUGARCANE AND MULTI-CROP SYSTEM SRIGANGANAGAR RAJASTHAN CANAL AND GROUNDWATER IRRIGATION, WITH COTTON, WHEAT AND MUSTARD BUKKACHERLA KOTHAPALLE 25F GULABEWALA Methodology • Income includes all cash and kind incomes. • All incomes are net of costs incurred by the households in the process of production and income generation. • The surveys used a comprehensive definition of incomes, and included detailed modules on incomes from crop cultivation, from animal husbandry and from wage labour, as well as from salaried employment, non-agricultural self-employment, rent and other transfers. • A total of 20 sources of income were used to construct the final income variable. • Survey years: 2005-06 (5 villages) and 2006-07 (3 villages) • All incomes at 2005-06 prices Table 2 Mean and median annual household incomes (in Rs) VILLAGE STATE YEAR MEAN MEDIAN ANANTHAVARAM ANDHRA PRADESH 2006 59,173 25,629 BUKKACHERLA ANDHRA PRADESH 2006 36,572 19,517 KOTHAPALLE ANDHRA PRADESH 2006 33,987 22,309 HAREVLI UTTAR PRADESH 2006 70,477 26,575 MAHATWAR UTTAR PRADESH 2006 31,237 19,895 WARWAT KHANDERAO MAHARASHTRA 2007 58,115 31,488 NIMSHIRGAON MAHARASHTRA 2007 69,074 40,293 RAJASTHAN 2007 149,774 38,430 25f GULABEWALA Table 3 Mean per capita income, study villages in Rs per annum at 2005-06 prices Village (State) Year of survey All Ananthavaram (AP) 2005-06 16,676 Bukkacherla (AP) 2005-06 9,536 Kothapalle (AP) 2005-06 9,438 Harevli (UP) 2005-06 11,657 Mahatwar (UP) 2005-06 4,487 Warwat Khanderao (MAH) 2006-07 11,108 Nimshirgaon (MAH) 2006-07 13,819 25 F Gulabewala (RAJ) 2006-07 26,991 Table 4 Gini coefficients of per capita income, by village (in per cent) Village Persons Ananthavaram 60.2 Bukkacherla 53.9 Kothapalle 56.5 Harevli 59.8 Mahatwar 51.6 Warwat Khanderao 53.1 Nimshirgaon 49.1 25 F Gulabewala 68.6 Note. These are adjusted Gini coefficients, following Chen, Tsaur and Rhai (1982). There were substantial variations across villages, although the common feature of the three villages with higher than average inequality was that they were canal-irrigated villages. Table 5 Gini coefficients of per capita income, selected countries Gini coefficient of per capita income Country/Region (%) Slovak Republic 19.5 Paraguay 62.3 Latin America 56.0 Europe 36.0 Japan 27.1 Former Soviet Union countries 34.4 China* 36.0 India* 30.0 Palma (2006) and *from ESCAP Yearbook 2009. Table 6 Distribution of per capita income by decile, study villages in per cent Decile Ananthavaram Bukkacherla Warwat Khanderao Nimshirgaon 25 F Gulabewala 1 0.43 -0.37 1.12 1.80 0.64 2 1.64 2.03 2.41 2.65 1.06 3 2.60 2.95 3.25 3.47 1.41 4 3.42 4.15 3.99 4.41 1.88 5 4.39 5.91 5.11 5.36 2.49 6 5.94 6.89 6.65 6.77 3.66 7 7.68 9.16 8.58 8.95 6.06 8 9.92 11.93 11.61 12.55 10.52 9 14.28 17.56 16.29 16.54 18.36 10 49.70 39.78 40.99 37.50 53.92 All 100.00 100.00 100.00 100.00 100.00 3.48 2.27 2.52 2.27 2.94 D10/D9 Figure 1. Kernel density plots of per capita incomes for persons belonging to Dalit and Other households, Ananthavaram, Andhra Pradesh Figure 2. Kernel density plots of per capita incomes for persons belonging to Dalit and Other households, Bukkacherla, Andhra Pradesh Figure 3. Kernel density plots of per capita incomes for persons belonging to Dalit and Other households, 25 F Gulabewala, Rajasthan
