Prezentacja programu PowerPoint
advertisement

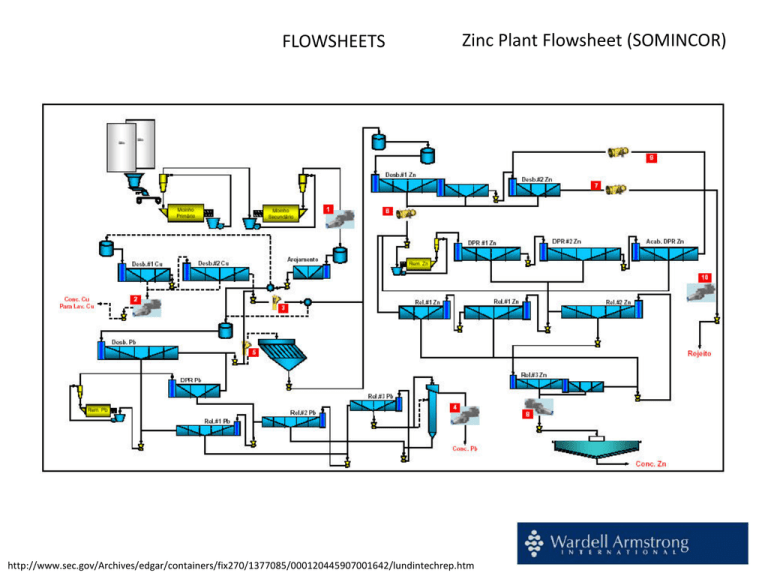
FLOWSHEETS Zinc Plant Flowsheet (SOMINCOR) http://www.sec.gov/Archives/edgar/containers/fix270/1377085/000120445907001642/lundintechrep.htm Analysis of flowsheets SIMPLE CASE Feed semiproduct P1 1 2 concentrate C1 concentrate C2 final concentrate semiproduct P2 3 concentrate C3 tailing O final tailing Balance of each node GRADE – content of a component in feed %, – content of a component in concentrate, %, – content of a component in combined products, %, – content of a component in tailing, % semiproduct P1 feed α Input data input parameters: α, , concetrate calculated parameteres: , , r, a… tailing concentrate C1 concentrate C2 concentrate C3 – yield of a product , % – recovery of a considered component in a product, % r – recovery of other than considered components in another product, % feed Node # 1 2 3 Grade concentrate α % 1.421 15.250 0.219 % 15.25 29.00 0.60 tailing Concentrate * yield recovery ν γ ε % 0.2185 7.0000 0.1500 % 8.00 37.50 15.22 % 85.85 71.31 41.80 *, and r calculated from α, , Tail* recovery Selectivity εr a % 93.122 68.584 84.836 101.232 122.591 133.133 EQUATIONS 100( ) /( ) ( ) / (%) (%) r 100 (100 ) /(100 ) (%) a r r /( r 100) a = 100 ideal separation , a ~ 1000 no separation (-) Flowsheet with balances of nodes (local balances) feed F 1.421 100.0 100.0 product grade ,% yield,% recov., % 1 P1 15.25 8.00 85.85 P2 0.2185 92.00 14.15 2 C1 29.00 37.50 71.31 concentrate C1 3 C2 7.000 62.50 28.69 concentrate C2 C3 0.60 15.22 41.80 concentrate C3 T 0.150 84.84 58.20 tailing T Upgrading curves for nodes using local balances conclusion: separation is best in node 1 (a=101.30 and worse in nodes 2 and 3, a=~125) Best flotation results upgrading curve Product C1 C2 C3 T F 29.00 7.00 0.60 0.15 1.42 29.00 15.25 5.93 1.42 3.00 5.00 14.00 78.00 0.00 3.00 8.00 22.00 100.00 100.00 61.22 24.63 5.91 8.23 EQUATIONS weighted average for instance for products C1+C2 ( ) C1C1 C 2C 2 C1 C 2 0.00 61.22 85.86 91.77 100.00 r r 100.00 97.84 95.28 85.88 20.99 100.00 97.84 93.12 79.01 0.00 Global balance of flowsheet α 1 concetrate 2 local , 2,c, 2,c, tailing α , 2,T, 2,T global G = 1-2,c= 1,c 2,c/100 G = 1-2,T= 1,T 2,T/100 G = 1-2,c= 1,c 2,c/100 G = 1-2,T= 1,T 2,T/100 concetrate tailing Global balance of flowsheet Options of industrial flowsheet Feed semiproduct P1 concentrate C1 1 semiproduct P2 2 3 concentrate C2 tailing T concentrate C3 4 final concentrate Cf final tailing Tf Cf=C1 Option 1 C1 Cf 29.00 29.00 3.00 3.00 C2 C3 T Tf 7.00 0.60 0.15 0.57 5.00 14.00 78.00 97.00 F 1.42 100.00 Final concentrate, C f 3.00 29.00 3.00 29.00 Final tailing, T f 8.00 15.25 22.00 5.93 100.00 1.42 100.00 0.57 Feed, F 100.00 1.42 r 61.22 61.22 61.22 61.22 97.84 97.84 24.63 5.91 8.23 38.78 85.86 91.77 100.00 100.00 93.12 79.01 0.00 0.00 100.00 100.00 0.00 Feed concentrate C1 1 Feed semiproduct P2 2 semiproduct P1 = semiproduct P1 3 = concentrate C2 tailing T concentrate C3 5 semiproduct P2 2 3 final concentrate C 4 final concentrate C f 1 final tailing T f final tailing T f Cf=C1+C2 Option 2 C1 C2 Cf 29.00 7.00 15.25 3.00 5.00 8.00 C3 T Tf 0.60 0.15 0.22 14.00 78.00 92.00 F 1.421 100.00 Final concentrate, C f 3.00 29.00 8.00 15.25 8.00 15.25 Final tailing, T f 22.00 5.93 100.00 1.42 100.00 0.22 Feed, F 100.00 1.42 r 61.22 24.63 85.86 61.22 85.86 85.86 97.84 93.12 93.12 5.91 8.23 14.14 91.77 100.00 100.00 79.01 0.00 0.00 100.00 100.00 0.00 f Feed semiproduct P1 1 semiproduct P2 concentrate C1 2 3 concentrate C2 concentrate C3 tailing T 4 final concentrate C f final tailing T f Cf=C1+C2+C3 Option 4 C1 C2 C3 Cf 29.00 7.00 0.60 5.93 3.00 5.00 14.00 22.00 T Tf 0.15 0.15 78.00 78.00 F 1.421 100.00 Final concentrate, C f 3.00 29.00 8.00 15.25 22.00 5.93 22.00 5.93 Final tailing, T f 78.00 1.42 100.00 0.15 Feed, F 78.00 1.42 r 61.22 24.63 5.91 91.77 61.22 85.86 91.77 91.77 97.84 93.12 79.01 79.01 8.23 8.23 8.23 100.00 0.00 0.00 100.00 100.00 0.00 Feed 1 semiproduct P1 concentrate C1 semiproduct P2 2 3 concentrate C2 tailing T concentrate C3 5 4 final concentrate C f final tailing T f Cf=C1+C3 Option 3 C1 C3 Cf 29.00 0.60 5.61 3.00 14.00 17.00 C2 T Tf 7.00 0.15 0.56 5.00 78.00 83.00 F 1.421 100.00 Final concentrate, C f 3.00 29.00 17.00 5.61 17.00 5.61 Final tailing, T f 22.00 5.93 100.00 1.42 100.00 0.56 Feed, F 100.00 1.42 r 61.22 5.91 67.14 61.22 67.14 67.14 97.84 83.72 83.72 24.63 8.23 32.86 91.77 100.00 100.00 79.01 0.00 0.00 100.00 100.00 0.00 Feed 1 semiproduct P1 concentrate C1 semiproduct P2 2 3 concentrate C2 concentrate C3 tailing T 4 final concentrate Cf final tailing T f Cf=C2 Option 8 C2 Cf 7.00 7.00 5.00 5.00 C1 C3 T Tf 29.00 0.60 0.15 1.13 3.00 14.00 78.00 95.00 F 1.421 100.00 Final concentrate, C f 5.00 7.00 5.00 7.00 Final tailing, T f 8.00 15.25 22.00 5.93 100.00 1.42 100.00 1.13 Feed, F 100.00 1.42 r 24.63 24.63 24.63 24.63 95.28 95.28 61.22 5.91 8.23 75.37 85.86 91.77 100.00 100.00 93.12 79.01 0.00 0.00 100.00 100.00 0.00 Selectivity of separation for different options of composition of final flotation products Feed 1 semiproduct P1 concentrate C1 semiproduct P2 2 concentrate C2 4 final concentrate Cf final tailing T f Feed ideal upgrading C1 C2 90 C1+C2 1 semiproduct P1 semiproduct P2 3 80 C1+C3 C2+C3 4 concentrate C3 tailing T C1+C2+C3 70 final concentrate Cf 60 a=101.3 50 40 30 C1+C2+O 20 10 = 0 0 10 20 30 40 50 60 70 80 useful component recovery in concentrate, , % 90 ideal remixing other than useful comp.recovery in tailing , r, % 100 100 final tailing T f Selection of optimum point of process ideal upgrading 90 80 C1+C2 C1 C2 common sense optimum point of separation C1+C3 C2+C3 C1+C2+C3 70 example of point of optimum separation based on economics 60 a=101.3 50 40 30 C1+C2+O 20 10 ideal remixing other than useful comp.recovery in tailing , r, % 100 0 0 10 20 30 40 50 60 70 80 90 100 useful component recovery in concentrate, , % Final decision: Cf=C1+C2 + something depending on criterion of upgrading optimal point 100 ( a ) 1002 (100 ) 100a 100 90 80 70 ideal upgrading C2 C2+C3 C1 C1+C C1+C C1+C2+C 60 50 a=101.3 40 30 20 C1+C2+ 10 ideal remixing (100 r ) a (a r ) other than useful comp.recovery in tailing , r, % Transformation of the Fuerstenau(recovery-recovery or -) upgrading curve into Halbich (grade-recovery or β- ) upgrading curve 0 0 10 20 30 40 50 60 70 80 90 100 useful component recovery in concentrate, , % the Fuerstenau (- ) is alfa -insensitive equivalent of the Halbich ( β- ) upgrading curve FLOWSHEET WITH A RECYCLE STREAM feed 1 1 feed 2 semiproduct P2 semiproduct P1 3 2 semiproduct P3 concentrate C1 concentrate C2 4 5 concentrate C3 tailing T final concentrate Cf final tailing T f Flowsheet with balance of nodes (local balances) input parameters: α, , Feed 1 F1 21.95 P1 0.89 C2 88.23 , % , % C3 78.05 0.60 60.04 1.42 39.96 1 F2 100.00 Product , % 0.78 100.00 2 25.00 28.40 3.00 88.23 P1 11.77 25.00 11.77 P3 100.00 5.59 100.00 25.00 52.63 Concentrate 1=P1 0.57 71.60 P2 100.00 0.57 100.00 3 4 C1 11.76 P2 99.11 5 C2 88.24 3.00 47.37 C3 78.48 0.60 83.30 T 21.52 Tailing 0.44 16.70 EQUATIONS Recycle node (1) 100 F 2 F 1 F 1 (100 F 1 )C 3 F1F1 F1 100F 2 Separating nodes 100( ) /( ) (%) ( ) / (%) r 100 (100 ) /(100 ) (%) a r r /( r 100) a = 100 ideal separation , a ~ 1000 no separation (-) node 2 4 5 25,00 0,57 0,78 0,89 99,11 25,00 3,00 5,59 11,76 88,24 0,60 0,44 0,57 78,48 21,52 0,00 0,89 100,00 0,00 11,76 100,00 0,00 78,48 100,00 28,40 71,60 52,63 47,37 83,30 16,70 0,00 28,40 100,00 0,00 52,63 100,00 0,00 83,30 100,00 r 100,00 99,33 0,00 r 100,00 90,65 0,00 r 100,00 21,55 0,00 Upgrading curves for nodes using local balances feed 1 feed 1 1 1 feed 2 feed 2 semiproduct P1 semiproduct P1 semiproduct P2 2 semiproduct P2 2 5 5 concentrate C3 concentrate C3 tailing T final concentrate Cf final tailing T f tailing T final concentrate Cf final tailing T f node 5 is not efficient Global balance of flowsheet (feed F2 is 100%) Eqs for recycling nodes F 2 C 3 F1 FEED 1 F2 0.78 450.00 247.78 C2 30.00 3.00 63.34 25.00 70.37 Concentrate C3 0.60 350.00 147.78 2 25.00 70.37 P2 0.57 446.00 177.41 3 4 C1 4.00 F 2 C 3 F1 F1 1.42 100.00 100.00 1 P1 4.00 known parameters: α, , P3 5.59 34.00 133.71 C2 30.00 5 3.00 63.34 C3 0.60 350.00 147.78 T 96.00 0.44 29.63 Tailing 1 Calculations Feed 1: grades are known, G and n are equal to 100% G 2 β Node 1 Grades are known, local and for F1 are known (=21.95%) (for C3 is 100- 21.95 =78.05%) or can be calculated from grades of products 100 11 (100 1 ) 2 Calculation of global for F2 Q) How large is for C3 when for F1 is 100%? A) When F1=100%, C3 =(100/21.95)x 78.05= 350%. Then F2= F1+ C3 = 100+350=450% 100 F 2 F 1 F 1 (100 F 1 )C 3 G F1 100% G C3 C3 100 F1 F1 C3 1 F2 Calculation of for recycling node (here F2): FG1 100% F1 C3 G C3 G F2 100 C 3 F1 100 F 2 F1 FG2 CG3 100% 1 F2 Calculation for (normal) separation nodes P2 G C3 G C3 P 2 C 3 100 P 2 C 3 100 5 P2 C3 T C3 T Graphical representation of separation data (not very useful, recoveries greater than 100%) Grade –recovery curve for Pb, Cu and Zn circuits within the Eureka Concentrator (based on Ch. Greet, Spectrum Series, 2010) Some flowsheets can be complex 100.000 t/h L% % Cu bb % BI % 281.466 BII % 0.011 100.000 0.851 0.005 0.006 3 0.0091 366.536 19.636 6.680 0.075 50.184 45.655 0.005 0.129 0.022 0.002 0.092 2.435 100.0783 0.0020 0.003 0.260 0.007 9.840 0.021 20.3013 0.0070 32.372 0.260 172.665 81.281 0.007 0.216 143.687 143.687 158.795 0.011 0.075 0.643 7.130 0.096 68.274 62.842 50.017 70.319 0.007 Balast II 2 3.779 0.071 69.8499 62.712 0.335 8.865 0.0085 57.579 0.113 3a 91.577 242.515 100.000 282.018 12.298 26.770 0.005 21.901 89.347 13.361 45.972 55.120 0.011 1 1 5 100.000 0.028 0.028 2.928 0.006 1.595 177.865 62.712 215.770 Flotacja Główna a b 0.260 65.9125 0.0104 0.0066 0.004 0.004 54.333 0.358 10.680 15.745 6.050 28.006 0.091 0.314 0.205 54.913 188.937 50.543 90.011 226.535 0.01786 2 1.595 1.595 0.824 3.352 88.701 0.011 0.034 30.014 0.010 0.310 0.755 23.3027 0.0138 0.0023 0.004 0.003 Flotacja Główna c 1.230 0.081 0.277 9.874 33.974 2.177 0.230 72.727 0.490 11.231 0.967 0.246 22.339 50.017 45.503 89.320 66.289 13.090 0.038 172.093 81.011 0.910 72.865 4.260 118.017 0.172 0.591 0.205 72.865 250.703 86.857 Flot. Czyszcząca II 6 0.132 0.046 59.622 0.216 155.503 0.471 0.910 10.653 3 1.595 2.597 80.1767 0.0081 37.158 178.004 0.0280 66.092 2.994 4a 89.320 21.413 38.086 Hydrocyklon 1.687 38.642 17.909 13.428 4b 23.303 37.158 0.200 0.674 13.428 100.078 2.320 46.203 178.004 4 Balast I 5 6 1.595 178.427 7 31.854 100.000 2.177 49.873 49.763 0.967 8 100.000 100.000 2.928 0.751 77.661 0.133 22.847 20.785 1.720 0.751 0.459 78.610 37.005 0.817 27.273 82.091 0.850 0.610 2.928 177.865 178.585 0.751 0.159 27.235 71.032 0.751 128.554 70.763 7 9 8 2.598 0.017 2.928 2.608 68.274 201.923 0.034 5.212 0.740 0.851 100.000 2.550 0.075 19.1569 0.0019 0.002 30.548 111.912 0.920 0.476 0.609 94.788 5a 1.836 0.010 68.274 1.067 90.639 62.920 62.842 0.216 153.367 281.655 1.836 0.643 0.331 234.909 111.912 Flot. Czyszcząca I 1.180 100.000 1a 2.928 0.010 0.551 0.851 100.000 9.758 0.120 0.184 0.817 2.197 3.504 0.633 9.758 7.560 9.758 6.232 9.736 0.00273 The Eureka Mine – An Example of How to Identify and Solve Problems in a Flotation Plant Christopher Greet Useful literature Publications : Spectrum Series Flotation Plant Optimisation: A Metallurgical Guide to Identifying and Solving Problems in Flotation Plants Spectrum Series 16 Published in 2010 The Eureka Mine – An Example of How to Identify and Solve Problems in a Flotation Plant Christopher Greet Homework Create your own flowsheet and calculate local and global balanses as well as plot graphs which will help you to evaluate the plant performance


