PowerPoint - Susan Schwinning
advertisement
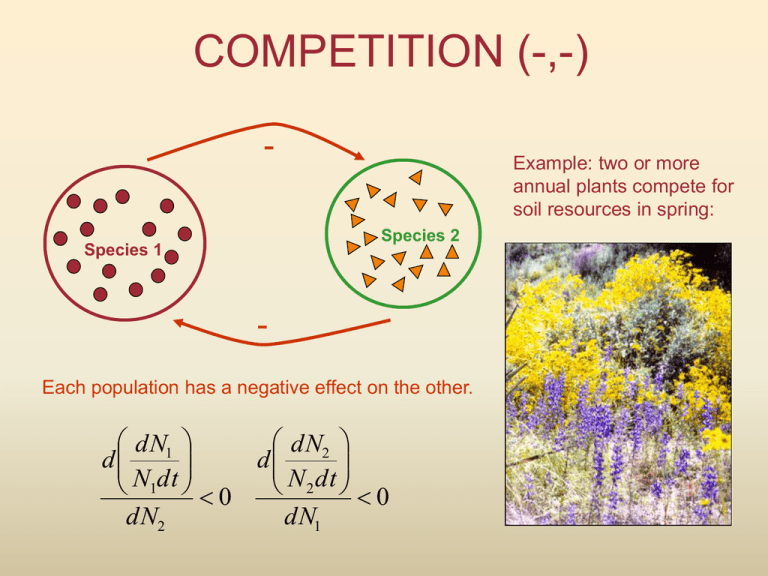
COMPETITION (-,-)
-
Example: two or more
annual plants compete for
soil resources in spring:
Species 2
Species 1
Each population has a negative effect on the other.
dN1
dN2
d
d
N1dt 0
N 2 dt 0
dN2
dN1
Paramecium caudatum
Testing the
consequences of
species interactions:
Georgii Frantsevich
Gause (b. 1910)
Paramecium aurelia
Gause’s competitive exclusion principle:
Two species competing for the same resources cannot stably coexist
if other ecological factors are constant. One of the two competitors
will always overcome the other, leading to the extinction of this
competitor: Complete competitors cannot coexist.
Overcoming Gause’s exclusion principle:
If two species utilize sufficiently separate niches, the competitive
effects of one species on another decline enough to allow stable
coexistence.
Chthalamus
Balanus
The two species live in different sections of rock:
Desiccation tolerance limits here
Predation tolerance limits here
The two species fundamental niche is where each
organism can settle and thrive in the absence of the other:
Here Balanus outcompetes
Chthalamus
Here Chthalamus outcompetes Balanus
growth
rate
Balanus larvae settle
Chthamalus larvae settle
low
middle
Location in intertidal zone
high
Balanus alone
Balanus
fundamental
niche
growth
rate
Chthamalus alone
Chthamalus
fundamental niche
low
middle
Balanus
realized
niche
growth
rate
high
Balanus and Chthamalus together
Chthamalus
realized niche
low
middle
high
Location in intertidal zone
Frequency of occurrence
(Werner and Platt 1976)
Animals trapped as a function of time
Diverse community of tropical rodents in Mexico
Castro-Arellano & Lacher 2009
Some ants forage at different times.
If ants forage at the same times, then not in the same place.
10:30
Coyote (10 – 25 kg)
Food: sheep, poultry, mice, rabbits,
ground squirrels, other small rodents,
insects, reptiles, fruits and berries.
Red fox (4 – 8 kg)
Food: mice, voles, woodchucks, rabbits,
chipmunks, fruits, insects, birds and
eggs, carrion, garbage, amphibians, and
reptiles.
Relative
food
use
Coyote
Red Fox
insects
birds
rodents
rabbits
Food item size
young livestock
LOTKA AND VOLTERRA
(Pioneers of two-species models)
Alfred J. Lotka (1880-1949)
Chemist, ecologist, mathematician
Ukrainian immigrant to the USA
Vito Volterra (1860-1940)
Mathematical Physicist
Italian, refugee of fascist Italy
Let’s say, two species are competing for the same limited space:
In what ways can the species be different?
K1 25
K2 100
The two species might have a different carrying capacities.
time
time
r1 2
per year
r2 4
per year
The two species might have different maximal rates of growth.
When alone each species might follow the logistic
growth model:
For species 1:
K1 N1
dN1
r1 N1
dt
K1
For species 2:
K2 N2
dN2
r2 N 2
dt
K2
How do we express the effect one has on the other?
4 purple squares
have the same
effect as 1 orange
square.
The effect of the small purple pecies on the growth rate of the large green species:
1
K1 N1 N 2
dN1
4
r1 N1
dt
K1
The effect of the large orange species on the growth rate of the small blue species:
K 2 N 2 4 N1
dN2
r2 N 2
dt
K2
The Lotka-Volterra two-species competition model:
K1 N1 N 2
dN 1
r1 N1
dt
K1
K 2 N 2 N1
dN2
r2 N 2
dt
K2
Two state variables: N1 and N2, which change in response to one another.
6 parameters: r1, K1, ,r2 ,K2 ,, which stay constant.
and are new to us: they are called interspecific competition coefficients.
Excel Worksheets:
• Two-species competition
The Lodka-Volterra Model predicts four outcomes for the
competitive interaction:
1. Coexistence, no matter what the initial densities of the
two species.
2. Species 1 always wins.
3. Species 2 always wins.
4. Depending on the initial densities, either species 1 or
species 2 wins.
Zero-growth isocline:
The set of all {N1,N2} pairs that make the growth rate of
either N1 or N2 equal to zero.
K1 N1
N2
N2 K2 N1
This equation tells us where dN1/(N1dt) = 0.
It’s called the N1 isocline.
This equation tells us where dN2/(N2dt) = 0.
It’s called the N2 isocline.
ISOCLINES:
N2
K1 N1
N2
K1
N2 K2 N1
N1 isocline
K2
N2 isocline
K1
N1
K2
This is called a state space graph.
N2
K1
N1 isocline
K2
The equilibrium!
N2 isocline
K1
N1
K2
The N1 isocline
N2
K1
dN1/(N1dt) < 0
dN1/(N1dt) > 0
N1
K1
The N2 isocline
N2
K2
dN2/(N2dt) < 0
dN2/(N2dt) > 0
N1
K2
This equilibrium is stable!
K1
N2
K2
N1 isocline
K1
Test the prediction.
N1
N2 isocline
K2
N2
K2
N2 isocline
Case 2:
• an unstable equilibrium
• only one of the two species survives
• which one survives depends on initial
population densities.
K1
N1 isocline
K2
Test the prediction.
N1
K1
Case 3:
• no two-species equilibrium
• species 1 always wins
K1
N2
K2
Test the prediction.
N1
K2
K1
Case 4:
• no two-species equilibrium
• species 2 always wins
K2
N2
K1
Test the prediction.
N1
K1
K2
K1
N2
Case1 :
K2<K1/ and K1<K2/
N2
Case 2:
K2>K1/ and K1>K2/
K1
K2
K1
K1
K2
N1
K2
Case 3:
K2<K1/ and K1>K2/
K2
K2
K1
N1
Case 4:
K2>K1/ and K1<K2/
K1
K2
K2
K1
K1
K2
When makes two species coexist?
Each species must be its own worst competitor.
Each species must be able to recover from low density,
when the other is at carrying capacity.
Mathematically: K2 < K1/ and K1<K2/ or if K1 = K2:
<1 and <1
Intraspecific competition must exceed interspecific competition.
Biologically, what does this mean?
The resource requirements of members of the same species must
be more similar than those of members of other species.
Even when a species is at high density, enough resources
are left over for the other species to achieve positive growth rates
at low density.
