Unit2Macro - Inflate Your Mind
advertisement
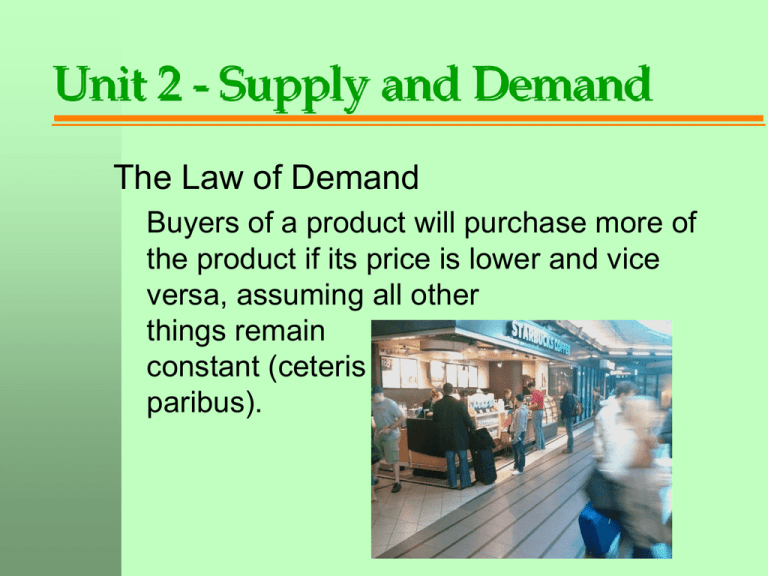
Unit 2 - Supply and Demand The Law of Demand Buyers of a product will purchase more of the product if its price is lower and vice versa, assuming all other things remain constant (ceteris paribus). Unit 2 - Supply and Demand Two Reasons Why Buyers Buy More at Lower Prices and Less at Higher Prices The Substitution Effect The Income Effect Unit 2 - Supply and Demand Substitution Effect When the price of a product decreases, ceteris paribus, the product becomes cheaper. It is, therefore, more attractive relative to other products (and vice versa). Unit 2 - Supply and Demand Income Effect When the price of a product decreases, ceteris paribus, consumers have more relative income. They can, therefore, purchase additional products (and vice versa). Unit 2 - Supply and Demand One Buyer How much gasoline would you purchase at the following prices (gallons per month)? Price Per Gallon Quantity Demanded $2.50 50 $3.00 45 $3.50 42 $4.00 35 $4.50 20 $5.00 10 Price in Dollars Per Gallon 5.00 4.50 4.00 3.50 3.00 2.50 D One Individual’s Demand Curve Quantity Demanded Unit 2 - Supply and Demand Micro Why Do You Purchase 10 instead of 11 Gallons of Gasoline When You Visit the Gas Station? Unit 2 - Supply and Demand Micro Marginal Utility Marginal utility is the increase in satisfaction (as measured in “utils”) per additional item consumed. Unit 2 - Supply and Demand Micro The Law of Diminishing Marginal Utility As consumers purchase more of a product, the value (satisfaction) of additional items purchased declines. Unit 2 - Supply and Demand Several Buyers (the Market) Price $2.50 $3.00 How much gasoline would you purchase at the following prices (gallons/month)? $3.50 $4.00 $4.50 $5.00 Q1 Q2 Q3 Q4 Total buyer 1 buyer 2 buyer 3 buyer 4 market Price in Dollars Per Gallon 5.00 4.50 4.00 3.50 3.00 2.50 D Market Demand Curve Quantity Demanded Unit 2 - Supply and Demand The Demand Curve A change in the price is a movement along the demand curve. This is called a change in “quantity demanded”. Price $4 Individual product demand curves always extend from the upper left to the lower right. They are downward sloping. A B $1.75 Demand Curve 60 80 Quantity Demanded Unit 2 - Supply and Demand The Law of Supply Producers supply more of a product at higher than at lower prices, ceteris paribus (and vice versa). Unit 2 - Supply and Demand One Supplier If you had a small oil well in your backyard and it took you some effort to get the oil out, and you were able to sell the oil, how much gasoline would you supply if you could sell the oil at the following prices in the market (gallons per month)? Price Per Gallon $2.50 $3.00 $3.50 $4.00 $4.50 $5.00 Quantity Supplied Price in Dollars Per Gallon S 5.00 4.50 4.00 3.50 3.00 2.50 Individual Supply Curve Quantity Supplied Unit 2 - Supply and Demand Several Suppliers If you had a small oil well in your backyard and it took you some effort to get the oil out, and you were able to sell the oil, how much gasoline would you supply at the following prices (gallons per month)? Price $2.50 $3.00 $3.50 $4.00 $4.50 $5.00 Q1 Q2 Q3 Q4 Total seller 1 seller 2 seller 3 seller 4 market Price in Dollars Per Gallon S 5.00 4.50 4.00 3.50 3.00 2.50 Market Supply Curve Quantity Supplied Unit 2 - Supply and Demand The Supply Curve A change in the price is a movement along the supply curve from point A to point B. This is called a change in “ _______.” Price Supply Curve B $4.50 A supply curve is upward sloping. A $2 30 90 Quantity Supplied Unit 2 - Supply and Demand Reasons why producers produce more at higher prices The Substitution Effect When the market price increases, other competing products will become less profitable and less attractive to produce (and vice versa). The Income Effect When the price increases, the product earns more money (income) and the supplier has more incentive to produce (and vice versa). Unit 2 - Supply and Demand Equilibrium Price and Quantity In a free market the equilibrium price and quantity occur where the supply and demand curves intersect. Price S $3 D 50 Quantity Rent The Case of Rent Control S $1,800 $1,000 D 700 900 Quantity Demanded Price of Labor The Minimum Wage SL $7.50 $6.00 DL 900 1,000 1,100 Minimum Wage Quantity Demanded of Labor Price of Labor Minimum Wage – New York Example SL $10.00 $8.50 $7.50 DL 900 1,000 1,100 Quantity Demanded of Labor Unit 2 - Supply and Demand Demand Determinants The following changes will shift the demand curve to the right or to the left. A change in real incomes or wealth (normal and inferior products). A change in tastes or preferences. A change in the prices of related products (substitute and complementary products). A change in the expectation of the product’s future price or buyers’ future incomes. A change in the number of buyers (population). Unit 2 - Supply and Demand Equilibrium Price and Quantity When demand increases, the demand curve shifts to the right. Price S $4 $3 D2 D1 50 70 Quantity Equilibrium price increases, and equilibrium quantity increases. Unit 2 - Supply and Demand The Effect of a Change in Demand on Equilibrium Price and Quantity In the short run, when demand increases 1. the equilibrium price increases, and 2. the equilibrium quantity increases. In the short run, when demand decreases 1. the equilibrium price decreases, and 2. The equilibrium quantity decreases Unit 2 - Supply and Demand Supply Determinants The following changes will shift the supply curve to the right or to the left. An advance in technology. A change in input prices. A change in taxes, subsidies, or regulations. A change in the number of firms selling the product. Unit 2 - Supply and Demand Equilibrium Price and Quantity When supply increases, the supply curve shifts to the right. Equilibrium price decreases, S1 S2 and equilibrium quantity increases. Price $3 $2 D 50 60 Quantity Unit 2 - Supply and Demand The Effect of a Change in Supply on Equilibrium Price and Quantity When supply increases (a rightward shift of the supply curve) 1. The equilibrium price decreases, and 2. The equilibrium quantity increases. When supply decreases (a leftward shift of the supply curve) 1. The equilibrium price increases, and 2. The equilibrium quantity decreases. Unit 2 - Supply and Demand Changes in Demand and Supply – Example 1 What happens to the equilibrium price and quantity of an Ipod (a normal product) when simultaneously: Buyers’ incomes rise, and Technology to make the Ipods improves? What happens to the price and quantity bought/sold of Ipods if incomes rise and technology advances? 1. 2. 3. 4. Price down; quantity up Price same; quantity up Price up; quantity up Price down; quantity down 5. None of the above Unit 2 - Supply and Demand Changes in Demand and Supply – Example 1 Answer An increase in incomes will increase demand (price and quantity increase). An advance in technology will increase supply (price decreases and quantity increases). The combined effect is that price change is indeterminate and equilibrium quantity increases. Unit 2 - Supply and Demand Changes in Demand and Supply – Example 2 What happens to the equilibrium price and quantity of paper towels when simultaneously Buyers expect the future price of paper towels to be significantly higher in the near future. The government taxes the production of paper towels. Determine price and quantity of paper towels when future price is expected to rise and production tax rises 1. Pe increases; Qe decreases 2. Pe increases; Qe change is unknown 3. Pe decreases; Qe decreases 4. Pe increases; Qe increases 5. Pe is unknown; Qe decreases 6. none Unit 2 - Supply and Demand Changes in Demand and Supply Example 2 Answer The expectation of a higher future price increases the current demand for the product (price and quantity increase). The imposition of a government tax reduces the supply (price increases and quantity decreases). The combined effect is that the equilibrium quantity change is unknown (indeterminate) and the equilibrium price increases. Unit 2 - Supply and Demand Consumer Surplus is the difference in what consumers are willing to pay for the price of the product and what they are actually paying for it in the market. Price Consumer Surplus S $8 $7 $6 $5 D 90 100 110 120 Quantity Demanded Per Day Unit 2 - Supply and Demand Producer Surplus is the difference in what suppliers are willing to sell the product for and what they are actually receiving for it in the market. Price S Producer Surplus $5 $4 $3 $2 D 90 100 110 120 Quantity Demanded Per Day Unit 2 - Supply and Demand The Free Market Economy Free market economy = capitalist economy = laissez-faire economy = price system In a free market economy prices of goods and services, wages, interest rates, foreign exchange values, etc., are determined by supply and demand Unit 2 - Supply and Demand The Free Market Economy Should all prices, including wages, be determined by supply and demand? Celebrities receive millions of dollars per year in compensation Baltimore Sun photo by Ezra Shaw. Unit 2 - Supply and Demand The Free Market Economy and Externalities Do prices reflect their true market value? Businesses that pollute: 1. 2. 3. 4. Should be fined by the government and the revenue should be used to help clean the environment Should be forced to go out of business Should be allowed to operate just like any other business No opinion/other Organizations that provide products that have positive externalities: 1. 2. 3. 4. Should be subsidized by the government Should be fully funded by the government Should operate just like any other organization No opinion/other Unit 2 - Supply and Demand Prices of Manufactured Products Manufactured products are abundantly available and are produced in competitive industries. Examples include computers, cell phones, CDs, and bicycles. Prices of manufactured goods equal the cost of production plus a reasonable profit. Prices are rarely excessive, especially in the long run. Unit 2 - Supply and Demand Prices of Limited-Supply Products Examples of limited-supply products include land, office space, labor, Super Bowl tickets, and products sold by monopolies. Prices of limited-supply products can be excessive, even in the long run.

