International Economics and Business
advertisement
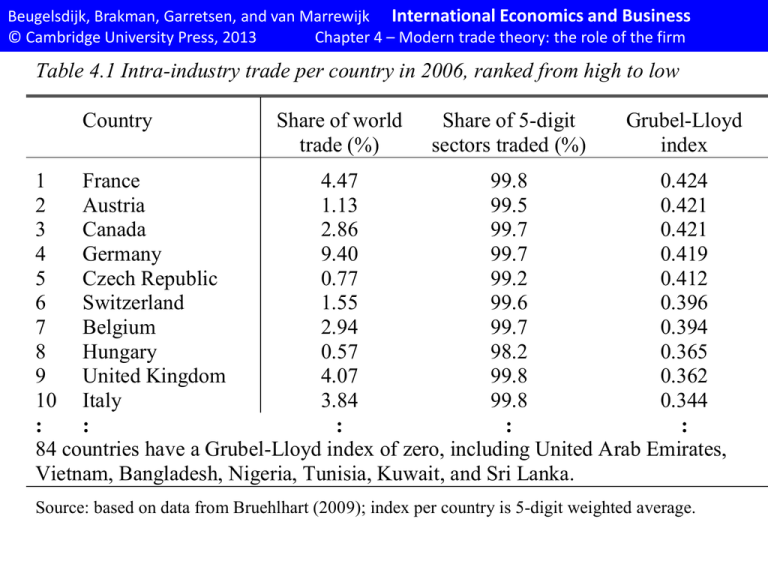
Beugelsdijk, Brakman, Garretsen, and van Marrewijk International Economics and Business © Cambridge University Press, 2013 Chapter 4 – Modern trade theory: the role of the firm Table 4.1 Intra-industry trade per country in 2006, ranked from high to low Country Share of world trade (%) Share of 5-digit sectors traded (%) Grubel-Lloyd index 1 France 4.47 99.8 0.424 2 Austria 1.13 99.5 0.421 3 Canada 2.86 99.7 0.421 4 Germany 9.40 99.7 0.419 5 Czech Republic 0.77 99.2 0.412 6 Switzerland 1.55 99.6 0.396 7 Belgium 2.94 99.7 0.394 8 Hungary 0.57 98.2 0.365 9 United Kingdom 4.07 99.8 0.362 10 Italy 3.84 99.8 0.344 : : : : : 84 countries have a Grubel-Lloyd index of zero, including United Arab Emirates, Vietnam, Bangladesh, Nigeria, Tunisia, Kuwait, and Sri Lanka. Source: based on data from Bruehlhart (2009); index per country is 5-digit weighted average. Beugelsdijk, Brakman, Garretsen, and van Marrewijk International Economics and Business © Cambridge University Press, 2013 Chapter 4 – Modern trade theory: the role of the firm Table 4.2 Cross-country determinants of intra-industry trade, 2006 (dependent variable = log transformed Grubel-Lloyd index) All sectors Primary Intermediate Final Log mean per capita GDP 1.617* (0.08) 1.534* (010) 1.918* (0.08) 1.513* (0.08) Log difference per capita GDP 0.0444 (0.07) -0.097 (0.09) 0.189* (0.07) -0.0668 (0.07) Log distance -0.700* (0.09) -1.161* (0.11) -0.622* (0.09) -0.923* (0.09) Contiguity 1.571* (0.41) 1.672* (0.53) 2.006* (0.45) 1.327* (0.44) Observations 1375 1354 1374 1373 R2 0.33 0.28 0.34 0.31 Source: based on Bruehlhart (2009); * indicates statistical significance at the 1% level. Beugelsdijk, Brakman, Garretsen, and van Marrewijk International Economics and Business © Cambridge University Press, 2013 Chapter 4 – Modern trade theory: the role of the firm Table 4.3 Exporter premia in US manufacturing, 2002 Exporter premia (%) Employment Shipments Value-added per worker TFP – total factor productivity Wage Capital per worker Skill per worker Additional covariates 164 194 12 3 6 13 12 Industry fixed effects Source: based on Bernard et al. (2007, Table 3); all results are significant at the 1 percent level. Beugelsdijk, Brakman, Garretsen, and van Marrewijk International Economics and Business © Cambridge University Press, 2013 Chapter 4 – Modern trade theory: the role of the firm Table 4.4 Productivity, exports, and foreign-ownership Normalized productivity National Exporter Foreign Domestic Foreign Exporter Size Medium Size Large Ln(GDP/cap) Constant 1 Manufactures 2 4 Services 5 3 6 0.046 0.039 0.043 0.020 0.013 0.013 (8.53)** 0.081 (7.43)** 0.070 (8.03)** 0.070 (1.79) 0.103 (1.13) 0.087 (1.17) 0.087 (9.80)** 0.092 (8.79)** 0.076 (8.80)** 0.075 (11.70)** 0.109 (9.96)** 0.078 (9.91)** 0.082 (10.12)** 0.042 (10.19)** 0.069 (12.83)** 0.115 (33.15)** -0.670 (21.56)** 6146 0.23 (8.53)** 0.038 (9.60)** 0.065 (12.36)** 0.126 (21.66)** -0.715 (13.74)** 6146 0.29 (8.39)** 0.036 (8.97)** 0.063 (11.91)** 0.080 (6.97)** -0.174 (1.35) 6146 0.32 (5.63)** 0.024 (3.99)** 0.009 (1.23) 0.067 (11.69)** -0.206 (4.00)** 3075 0.09 (4.15)** 0.018 (3.03)** 0.008 (1.05) 0.049 (4.61)** 0.103 (1.05) 3075 0.17 (4.32)** 0.019 (3.20)** 0.009 (1.22) 0.032 (1.12) 0.187 (0.71) 3075 0.20 0.000** 0.002** 0.660 0.000** 0.001** 0.801 Observations R-squared Test if coefficients are significantly different, F-test (Prob > F) 0.000** 0.001** 0.002** 0.000** NE v FD 0.000** 0.000** 0.001** 0.000** NE v FE 0.330 0.635 0.705 0.761 FD v FE Source: Chang and van Marrewijk (2013). Dependent variable: normalized productivity; robust t statistics in parentheses; * significant at 5%; ** significant at 1%; the specification in columns 2, 3, 5 and 6 include sector and country fixed effects; the 3rd and 6th specification also include sector-country interaction fixed effects; NE = National Exporter; FD = Foreign Domestic; FE = Foreign
