Service Line Reporting - Royal Shrewsbury Hospitals NHS Trust
advertisement
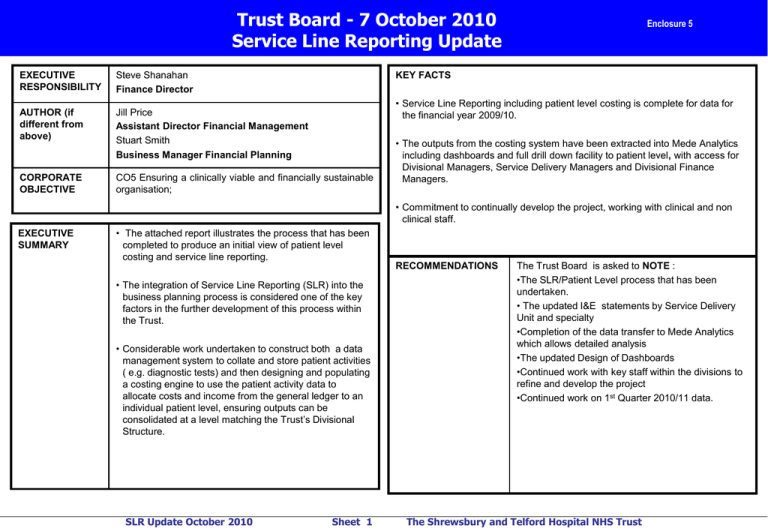
Trust Board - 7 October 2010 Service Line Reporting Update EXECUTIVE RESPONSIBILITY Steve Shanahan Finance Director AUTHOR (if different from above) Jill Price Assistant Director Financial Management Stuart Smith Business Manager Financial Planning CORPORATE OBJECTIVE CO5 Ensuring a clinically viable and financially sustainable organisation; Enclosure 5 KEY FACTS • Service Line Reporting including patient level costing is complete for data for the financial year 2009/10. • The outputs from the costing system have been extracted into Mede Analytics including dashboards and full drill down facility to patient level, with access for Divisional Managers, Service Delivery Managers and Divisional Finance Managers. • Commitment to continually develop the project, working with clinical and non clinical staff. EXECUTIVE SUMMARY • The attached report illustrates the process that has been completed to produce an initial view of patient level costing and service line reporting. • The integration of Service Line Reporting (SLR) into the business planning process is considered one of the key factors in the further development of this process within the Trust. • Considerable work undertaken to construct both a data management system to collate and store patient activities ( e.g. diagnostic tests) and then designing and populating a costing engine to use the patient activity data to allocate costs and income from the general ledger to an individual patient level, ensuring outputs can be consolidated at a level matching the Trust’s Divisional Structure. SLR Update October 2010 Sheet 1 RECOMMENDATIONS The Trust Board is asked to NOTE : •The SLR/Patient Level process that has been undertaken. • The updated I&E statements by Service Delivery Unit and specialty •Completion of the data transfer to Mede Analytics which allows detailed analysis •The updated Design of Dashboards •Continued work with key staff within the divisions to refine and develop the project •Continued work on 1st Quarter 2010/11 data. The Shrewsbury and Telford Hospital NHS Trust Section One – The Process The integration of Service Line Reporting (SLR) into the business planning process is considered one of the key factors in the further development of this process within the Trust. It gives us the ability to produce enhanced and genuinely credible financial management information at patient episode level, allowing clinicians and managers to work closely together in developing the Trust’s Service Lines Regular Service Line Reporting and Patient Level Costing information also has the ability to significantly impact the Trust’s Cost Improvement Programme, helping it to set differential targets based on Service Line Reporting information and helping managers understand where cost improvements can be achieved. The key objective of SLR is to provide a system that produces Service Line Reporting and Patient Level Costing information for both management and clinicians to help obtain real insight into performance and profitability and provides an objective basis for identifying opportunities for improvement. It allows the Trust to deep-dive into its own performance and provides patient episode level costs that help better understand the factors that influence patient outcomes, performance and profitability by specialty, consultant and point of delivery. The Trust appointed Bellis-Jones Hill in November 2009 to support their implementation of Service Line Reporting and Patient Level Costing using the Prodacapo Service Line Management System, using our existing Mede Analytics system to provide reporting functionality. Our first objective was to produce a model using the current information available ( 6months data for 2009/10) to provide a basis for which discussions with managers and clinicians could take place in order to develop a robust and detailed Service Line Reporting tool. This model has now been developed to include all of 2009/10. Detailed below are the tasks and stages we have had to complete in order to achieve this along with the re-designed I&E format outputs and initial design of the SLR dashboard. SLR Update October 2010 Sheet 2 The Shrewsbury and Telford Hospital NHS Trust Section Two – Inbound Data Staging Area (IDSA) The Implementation of the first PLC model required two separate work streams, the Inbound Data Staging Area and the Prodacapo costing model build. Pathology 1,601,191 lines of data Theatres High Cost Drugs 26,509 lines of data 631,867 lines of data Inbound Data Staging Area (IDSA) The IDSA is a data warehouse management and collation tool that stores the data gathered from the bespoke systems used within the Trust. Although the IDSA has a degree of flexibility to accept data in various formats, it was still necessary to liaise with the administrators of these systems to ensure the data is provided in a useable format that adds value to the costing process. Once the required data is provided in a suitable format the IDSA is dependant on the system administrators to provide same information being provided routinely in an identical format. Inbound Data Staging Area (IDSA) Radiology Ward Stay Data 252,422 lines of data 185,711 lines of data SLR Update October 2010 Sheet 3 All of the data sources contain all work carried out by the departments at a patient level with the exception of the pharmacy data which only attributes the high cost drugs to a patient level the remaining drug costs, such as ward stock, are mapped through to the patient via an alternative method. For example the ward stock of drugs would be apportioned to the particular ward and then from the ward to the patient based on the ward stay data set. The Shrewsbury and Telford Hospital NHS Trust Section Two – Inbound Data Staging Area (IDSA) Once these feeds had been imported they needed to be mapped to a patient, therefore we import the activity data for the same 12 month period. Inpatients The data from the departmental systems is then mapped to an individual patient attendance or episode. Some of the data is able to link directly to the patient, however, some data has to mapped by applying a set of rules which use an approximation in the absence of a direct link. For example the pathology data maps to a patient using the patient ID and date of test, therefore if a patient has a blood sample in an outpatient attendance, the pathology tests may not be carried out on the same day meaning a direct link will not be established, the rules will look to link the costs to the correct outpatient attendance. 122,770 episodes 103,673 spells Direct Access Currently at profit centre level Not patient level Inbound Data Staging Area (IDSA) A&E 103,099 attendances Outpatients 301,697 attendances SLR Update October 2010 Sheet 4 The Shrewsbury and Telford Hospital NHS Trust Section Three – Prodacapo Costing Engine System Prodacapo Costing Engine System General Leger Extract 9,767 cost lines Expense Category 175 Created Resources 377 Created The Prodacapo software takes the expenditure from the Trusts general ledger and allocates on the basis of either information from activity held in the support systems (eg bed days) or another assigned allocation method which is directly input into the costing system such (eg therapists) or even a combination of the two. For example Consultant time is split into the points of delivery (Daycase, outpatient etc) based on their job plan, and then allocated onto patient level. The diagram below represents the flow of information from the general ledger before being attached to a cost driver, and helps to explain why this part of the process is the most resource intensive. Activities 3,131 Created Cost Driver 3,300 Created Patient Level Patient Attributable Activity SLR Update October 2010 Sheet 5 The Shrewsbury and Telford Hospital NHS Trust Section Three – Prodacapo Costing Engine System General Ledger This extract from the ledger will cover all expenditure lines and are the combination of a cost centre for example Med Staff General Surgery and an expense type such as Consultant. Expense Category At this stage the expense types within the ledger are grouped into a general expense category for example a General Surgery consultant and a General Medicine consultant would fall under the same expense category of consultant. Resources The expense categories are then mapped to a resource, so the consultant expense category could be split into consultant inpatient, outpatient, theatre etc. Similarly a ward pay cost category could be broken into ward nursing pay and ward admin pay costs. Activities The resources are linked to a more specific activity, this activity may be for consultant A Inpatients cost or Ward Z nursing costs. At this stage the cost categories are determined, (e.g. nursing costs, drugs costs) which will then be used within the I&E statement. These are aimed to be a summarised version of our expenses types within our general ledger. We are limited to a maximum 18 cost categories within Prodacapo, Cost Drivers At this point every activity is linked to a cost driver that will take the costs to a patient level or, for some activities, the costs will be cascaded down through another activity before finally being allocated to a patient. SLR Update October 2010 Sheet 6 The Shrewsbury and Telford Hospital NHS Trust Section Four – Reporting Patient Level Costing Reporting Patient Level Costing Patient Level Costing 15,796,103 lines of data Patient Level Income 670,237 lines of data The reporting of the patient level information is now shown in Mede Analytics to ensure there is a single reference point for this management information within the Trust. In order to achieve this we have developed a process to extract the data from the costing system and provide a front end analytical tool within Mede Analytics. Data Extraction The data extraction from Prodacapo to Mede comes from two datasets. The first looking at the patient level costs and the second providing the patient level income. The patient level costing contains the volumes it does as it exports the details of the cost drivers linked to each patient, therefore for some patients they have in excess of 40 lines of data linked to them. Mede Analytics SLR Update October 2010 Sheet 7 The Shrewsbury and Telford Hospital NHS Trust Section Five – Mede Analytics SLR Dashboard Mede Analytics SLR Dashboard The Patient Level Costing/Service Line Reporting area within Mede was built to our specifications and includes many of the charts suggested by Monitor. The opening dashboard allows users to specify a Division, SDU or specialty. Further dashboards have been developed to show performance at a consultant and HRG Level. SLR Update October 2010 Sheet 8 The Shrewsbury and Telford Hospital NHS Trust Section Five – Mede Analytics SLR Dashboard Specialty A £6,313,900 Metrics Total Income Total Direct/Indirect Cost Direct Costs Direct Pay Costs Nursing Consultants Other Clinical Non-clinical Total: Direct Pay Costs £1,105,497 £804,184 £720,005 £155,197 £2,784,883 Drug Costs Supplies Other Direct Costs Total: Direct Non Pay Costs £319,669 £34,883 £78,890 £433,442 £3,218,327 Within Mede Analytics we have now re-designed the I&E statement to show EBITDA, finance and overhead costs (Corporate services and Estates). The updated statement also shows the number of records and the percentage of the total Trust income. It is also beyond to drill down to an individual patient level. An example of a I&E statement is shown. Direct Non Pay Costs Total: Direct Costs Indirect Costs Allied Healthcare Professionals Radiology Pathology Theatre Other Services Prosthetics Hotel Services Pharmacy Other Costs Total: Indirect Costs Total: Total Direct/Indirect Cost £140,909 £54,895 £346,245 £667,066 £342,770 £41,692 £54,701 £20,795 £0 £1,669,072 £4,887,399 £1,426,501 Site Costs Corporate Costs Total: Overhead Costs £312,526 £440,380 £752,906 £5,640,305 £673,595 10.67% £125,036 £548,559 8.69% Contribution Overhead Costs Cost EBITDA EBITDA % Finance Costs Total Profit Profitability Other Measures 22,531 2.42% No. of Records % Total Income SLR Update October 2010 Sheet 9 The Shrewsbury and Telford Hospital NHS Trust Section Five – Mede Analytics SLR Dashboard Service Delivery Unit Total Income Total Direct/Indirect Cost Contribution Overhead Costs EBITDA Finance Costs Total Profit Profitability Cancer 303 - CLINICAL HAEMATOLOGY 800 - CLINICAL ONCOLOGY (previously RADIOTHERAPY) Total: Cancer Critical Care 190 - ANAESTHETICS 320 - CARDIOLOGY 361 - NEPHROLOGY Total: Critical Care Emergency Care 110 - TRAUMA & ORTHOPAEDICS 180 - ACCIDENT & EMERGENCY Total: Emergency Care Medicine 300 - GENERAL MEDICINE 302 - ENDOCRINOLOGY 330 - DERMATOLOGY 340 - RESPIRATORY MEDICINE 400 - NEUROLOGY 410 - RHEUMATOLOGY 430 - GERIATRIC MEDICINE Total: Medicine Surgery 100 - GENERAL SURGERY 101 - UROLOGY 120 - ENT 130 - OPHTHALMOLOGY 140 - ORAL SURGERY 141 - RESTORATIVE DENTISTRY 143 - ORTHODONTICS 150 - NEUROSURGERY 160 - PLASTIC SURGERY 170 - CARDIOTHORACIC SURGERY 301 - GASTROENTEROLOGY Total: Surgery Women & Childrens 171 - PAEDIATRIC SURGERY 420 - PAEDIATRICS 421 - PAEDIATRIC NEUROLOGY 501 - OBSTETRICS 502 - GYNAECOLOGY 600 - GENERAL MEDICAL PRACTICE Total: Women & Childrens Total: OTHER Total: All £6,796,105 £11,973,946 £18,770,051 £7,053,167 £9,761,590 £16,814,757 -£257,062 £2,212,356 £1,955,294 £996,922 £1,241,354 £2,238,275 -£1,253,984 £971,002 -£282,981 £152,763 £278,521 £431,284 -£1,406,746 £692,481 -£714,265 -20.70% 5.78% -3.81% £6,021,846 £8,742,050 £10,722,509 £25,486,405 £8,234,773 £8,441,945 £7,241,287 £23,918,005 -£2,212,927 £300,104 £3,481,222 £1,568,400 £1,010,152 £1,381,249 £1,767,363 £4,158,764 -£3,223,079 -£1,081,144 £1,713,859 -£2,590,364 £89,183 £423,852 £314,848 £827,884 -£3,312,262 -£1,504,996 £1,399,011 -£3,418,248 -55.00% -17.22% 13.05% -13.41% £23,945,270 £9,151,183 £33,096,453 £20,012,231 £9,925,324 £29,937,555 £3,933,038 -£774,141 £3,158,898 £2,704,734 £1,848,934 £4,553,668 £1,228,305 -£2,623,075 -£1,394,770 £962,999 £512,271 £1,475,270 £265,305 -£3,135,346 -£2,870,041 1.11% -34.26% -8.67% £39,336,924 £175,681 £1,402,850 £160,451 £2,248,876 £550,581 £856,529 £44,731,891 £34,232,727 £81,685 £1,395,418 £241,469 £1,270,841 £358,780 £201,838 £37,782,758 £5,104,197 £93,996 £7,432 -£81,018 £978,035 £191,801 £654,691 £6,949,133 £4,669,565 £12,771 £250,866 £37,716 £154,270 £57,440 £31,830 £5,214,460 £434,632 £81,224 -£243,434 -£118,734 £823,764 £134,360 £622,860 £1,734,673 £1,001,295 £2,850 £59,450 £4,061 £34,689 £20,075 £5,753 £1,128,172 -£566,663 £78,375 -£302,884 -£122,795 £789,075 £114,286 £617,107 £606,501 -1.44% 44.61% -21.59% -76.53% 35.09% 20.76% 72.05% 1.36% £24,906,522 £6,741,835 £6,313,900 £8,814,822 £2,556,558 £65,999 £1,044,000 £20,401 £198,742 £140,931 £8,920,018 £59,723,728 £21,876,770 £5,760,595 £4,887,399 £8,000,433 £3,546,230 £35,274 £968,307 £13,527 £168,181 £65,594 £9,224,535 £54,546,845 £3,029,751 £981,240 £1,426,501 £814,389 -£989,672 £30,725 £75,693 £6,874 £30,562 £75,337 -£304,517 £5,176,883 £2,978,054 £841,726 £752,906 £1,159,163 £476,234 £8,195 £169,979 £2,781 £26,314 £13,469 £1,392,873 £7,821,694 £51,697 £139,514 £673,595 -£344,774 -£1,465,906 £22,530 -£94,286 £4,093 £4,248 £61,868 -£1,697,389 -£2,644,811 £767,246 £178,727 £125,036 £239,207 £118,373 £1,509 £30,352 £457 £9,035 £4,063 £400,052 £1,874,059 -£715,550 -£39,214 £548,559 -£583,981 -£1,584,279 £21,021 -£124,639 £3,636 -£4,787 £57,804 -£2,097,441 -£4,518,871 -2.87% -0.58% 8.69% -6.62% -61.97% 31.85% -11.94% 17.82% -2.41% 41.02% -23.51% -7.57% £1,293 £11,812,079 £53,112 £8,225,091 £17,887,136 £1,667 £37,980,378 £43,010,204 £262,799,110 £901 £13,942,202 £17,060 £6,217,138 £13,760,310 £267 £33,937,878 £21,587,361 £218,525,160 £393 -£2,130,123 £36,052 £2,007,952 £4,126,827 £1,399 £4,042,500 £21,422,842 £44,273,949 £37 £36 £382,676 -£4,614,912 £688 £31,847 £512,396 £226,279 £223,201 £1,560,266 £5 £1,346 £1,119,002 -£2,795,138 £1,547,403 £14,422,105 £8,403,074 £712,044 2.78% -39.07% 59.96% 2.75% 8.72% 80.77% -7.36% 33.53% 0.27% SLR Update October 2010 £320 £73 £2,102,113 -£4,232,236 £3,518 £32,535 £1,269,278 £738,675 £2,343,360 £1,783,467 £48 £1,351 £5,718,636 -£1,676,136 £5,453,335 £15,969,508 £35,158,832 £9,115,118 Sheet 10 Access to the PLC/SLR section in Mede is currently restricted to Divisional, SDU and Finance managers to allow additional validation of the methodology used for the 12 months and establish areas for development before future iterations of the model are made available to more users. Obviously this data will contain sensitive information around the cost of members of staff, therefore procedures will be introduced to mitigate the risks associated with this. It is now possible to begin deep-diving into any specialty that requires further analysis to help understand any variances. The table shows the SDU and specialty breakdown. With the data now fully available for analysis within Mede, the costing team will be working with the divisions to validate and develop the underlying assumptions within this current model. With the help, support and understanding of key clinical and non clinical staff within the divisions we aim to ensure of future models reflect their additional knowledge and understanding, producing outputs that are agreed with all parties involved. The Shrewsbury and Telford Hospital NHS Trust Section Six – Outstanding Issues We have changed the way we are reporting overheads, as some of the overhead costs were being reported as part of the Indirect costs, the changes we made ensure that any costs that sit outside of Divisions 1,2 and 3 will be reported as overheads. We have also completed the local validation of the 2nd six months of 2009/10. These revisions are now visible within Mede Analytics. Work also continues on the 1st Quarter 2010/11 data. Another issue that arises as a result of this process is the effect of Partially Completed Spells. Income and spell activity for an individual will only be recorded once they are discharged, but the support systems will be recording and counting that patient’s use of resources from their date of admission, generating legitimate cost but with no income or activity to match these against. Conversely, some spells activity will be showing the total income for the spell in one period when most of the costs were incurred and recorded within the previous period. Over a longer period and with a stable bed base, these issues will even themselves out, but within our particular 12 month model this had led to a net costs being apportioned back to specialty without patient income to match. Maintaining the costing model is proving to be more resource intensive that originally anticipated, due to the volume of new cost lines that are being created within the General Ledger. However, as we progress through further iterations of the model this process should become further automated and therefore freeing the resource time to develop the costing data following feedback. SLR Update October 2010 Sheet 11 The Shrewsbury and Telford Hospital NHS Trust
