pptx - Montana State University
advertisement

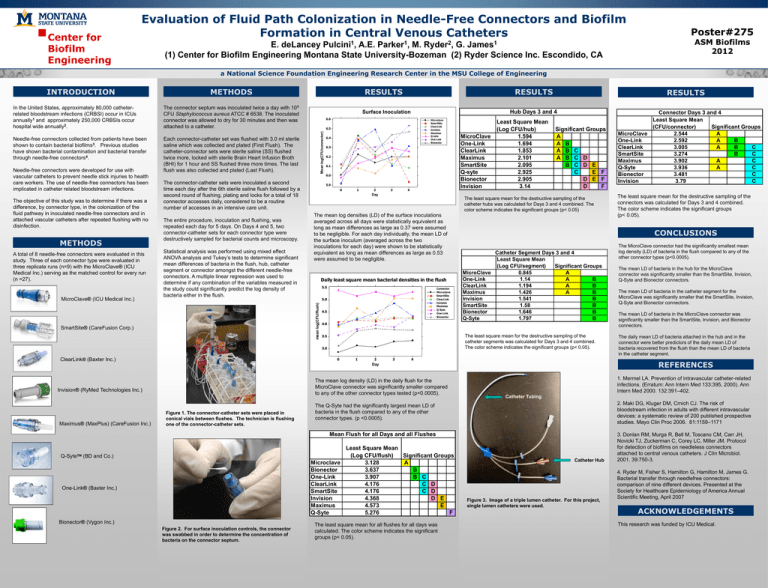
Center for Biofilm Engineering Evaluation of Fluid Path Colonization in Needle-Free Connectors and Biofilm Formation in Central Venous Catheters E. deLancey Pulcini1, A.E. Parker1, M. Ryder2, G. James1 (1) Center for Biofilm Engineering Montana State University-Bozeman (2) Ryder Science Inc. Escondido, CA Poster#275 ASM Biofilms 2012 a National Science Foundation Engineering Research Center in the MSU College of Engineering METHODS In the United States, approximately 80,000 catheterrelated bloodstream infections (CRBSI) occur in ICUs annually1 and approximately 250,000 CRBSIs occur hospital wide annually2. The connector septum was inoculated twice a day with 106 CFU Staphylococcus aureus ATCC # 6538. The inoculated connector was allowed to dry for 30 minutes and then was attached to a catheter. Needle-free connectors collected from patients have been shown to contain bacterial biofilms3. Previous studies have shown bacterial contamination and bacterial transfer through needle-free connectors4. Each connector-catheter set was flushed with 3.0 ml sterile saline which was collected and plated (First Flush). The catheter-connector sets were sterile saline (SS) flushed twice more, locked with sterile Brain Heart Infusion Broth (BHI) for 1 hour and SS flushed three more times. The last flush was also collected and plated (Last Flush). The objective of this study was to determine if there was a difference, by connector type, in the colonization of the fluid pathway in inoculated needle-free connectors and in attached vascular catheters after repeated flushing with no disinfection. METHODS A total of 8 needle-free connectors were evaluated in this study. Three of each connector type were evaluated in three replicate runs (n=9) with the MicroClave® (ICU Medical Inc.) serving as the matched control for every run (n =27). MicroClave® (ICU Medical Inc.) Statistical analysis was performed using mixed effect ANOVA analysis and Tukey’s tests to determine significant mean differences of bacteria in the flush, hub, catheter segment or connector amongst the different needle-free connectors. A multiple linear regression was used to determine if any combination of the variables measured in the study could significantly predict the log density of bacteria either in the flush. SmartSite® (CareFusion Corp.) Microclave SmartSite ClearLink Invision Maximus Q-syte One-Link Bionector 6.5 6.4 6.3 6.2 6.1 6.0 5.9 0 1 2 3 4 MicroClave One-Link ClearLink Maximus SmartSite Q-syte Bionector Invision Least Square Mean (Log CFU/hub) 1.594 1.694 1.853 2.101 2.095 2.925 2.905 3.14 Significant Groups A A B A B C A B C D B C D E C E F D E F D F Day The least square mean for the destructive sampling of the catheter hubs was calculated for Days 3 and 4 combined. The color scheme indicates the significant groups (p< 0.05) The mean log densities (LD) of the surface inoculations averaged across all days were statistically equivalent as long as mean differences as large as 0.37 were assumed to be negligible. For each day individually, the mean LD of the surface inoculum (averaged across the two inoculations for each day) were shown to be statistically equivalent as long as mean differences as large as 0.53 were assumed to be negligible. Daily least square mean bacterial densities in the flush 5.5 Connector Microclave SmartSite ClearLink Invision Maximus Q-Syte One-Link Bionector 5.0 4.5 3.5 Catheter Segment Days 3 and 4 Least Square Mean (Log CFU/segment) Significant Groups MicroClave 0.845 A One-Link 1.14 A B ClearLink 1.194 A B Maximus 1.426 A B Invision 1.541 B SmartSite 1.58 B Bionector 1.646 B Q-Syte 1.797 B The least square mean for the destructive sampling of the catheter segments was calculated for Days 3 and 4 combined. The color scheme indicates the significant groups (p< 0.05). 0 1 2 3 4 Invision® (RyMed Technologies Inc.) Maximus® (MaxPlus) (CareFusion Inc.) Figure 1. The connector-catheter sets were placed in conical vials between flushes. The technician is flushing one of the connector-catheter sets. One-Link® (Baxter Inc.) Bionector® (Vygon Inc.) Figure 2. For surface inoculation controls, the connector was swabbed in order to determine the concentration of bacteria on the connector septum. The least square mean for all flushes for all days was calculated. The color scheme indicates the significant groups (p< 0.05). The mean LD of bacteria in the hub for the MicroClave connector was significantly smaller than the SmartSite, Invision, Q-Syte and Bionector connectors. The mean LD of bacteria in the catheter segment for the MicroClave was significantly smaller that the SmartSite, Invision, Q-Syte and Bionector connectors. The mean LD of bacteria in the MicroClave connector was significantly smaller than the SmartSite, Invision, and Bionector connectors. The daily mean LD of bacteria attached in the hub and in the connector were better predictors of the daily mean LD of bacteria recovered from the flush than the mean LD of bacteria in the catheter segment. Catheter Tubing 2. Maki DG, Kluger DM, Crnich CJ. The risk of bloodstream infection in adults with different intravascular devices: a systematic review of 200 published prospective studies. Mayo Clin Proc 2006. 81:1159–1171 Mean Flush for all Days and all Flushes Q-Syte (BD and Co.) The MicroClave connector had the significantly smallest mean log density (LD) of bacteria in the flush compared to any of the other connector types (p<0.0005). 1. Mermel LA. Prevention of intravascular catheter-related infections. (Erratum: Ann Intern Med 133:395, 2000). Ann Intern Med 2000. 132:391–402. The Q-Syte had the significantly largest mean LD of bacteria in the flush compared to any of the other connector types. (p <0.0005). Least Square Mean (Log CFU/flush) Significant Groups Microclave 3.128 A Bionector 3.637 B One-Link 3.907 B C ClearLink 4.176 C D SmartSite 4.176 C D Invision 4.368 D E Maximus 4.573 E Q-Syte 5.276 F The least square mean for the destructive sampling of the connectors was calculated for Days 3 and 4 combined. The color scheme indicates the significant groups (p< 0.05). REFERENCES Day The mean log density (LD) in the daily flush for the MicroClave connector was significantly smaller compared to any of the other connector types tested (p<0.0005). Connector Days 3 and 4 Least Square Mean (CFU/connector) Significant Groups MicroClave 2.544 A One-Link 2.592 A B ClearLink 3.005 A B C SmartSite 3.274 B C Maximus 3.902 A C Q-Syte 3.936 A C Bionector 3.481 C Invision 3.79 C CONCLUSIONS 4.0 3.0 ClearLink® (Baxter Inc.) RESULTS Hub Days 3 and 4 6.6 The connector-catheter sets were inoculated a second time each day after the 6th sterile saline flush followed by a second round of flushing, plating and locks for a total of 18 connector accesses daily, considered to be a routine number of accesses in an intensive care unit. The entire procedure, inoculation and flushing, was repeated each day for 5 days. On Days 4 and 5, two connector-catheter sets for each connector type were destructively sampled for bacterial counts and microscopy. RESULTS Surface Inoculation mean log(CFU/flush) Needle-free connectors were developed for use with vascular catheters to prevent needle stick injuries to health care workers. The use of needle-free connectors has been implicated in catheter related bloodstream infections. RESULTS Mean log(CFU/connector) INTRODUCTION Catheter Hub Figure 3. Image of a triple lumen catheter. For this project, single lumen catheters were used. 3. Donlan RM, Murga R, Bell M, Toscano CM, Carr JH, Novicki TJ, Zuckerman C, Corey LC, Miller JM. Protocol for detection of biofilms on needleless connectors attached to central venous catheters. J Clin Microbiol. 2001. 39:750-3. 4. Ryder M, Fisher S, Hamilton G, Hamilton M, James G. Bacterial transfer through needlefree connectors: comparison of nine different devices. Presented at the Society for Healthcare Epidemiology of America Annual Scientific Meeting, April 2007 ACKNOWLEDGEMENTS This research was funded by ICU Medical.


