YSP_POSTER_10_v02 - Department of Biological Science
advertisement
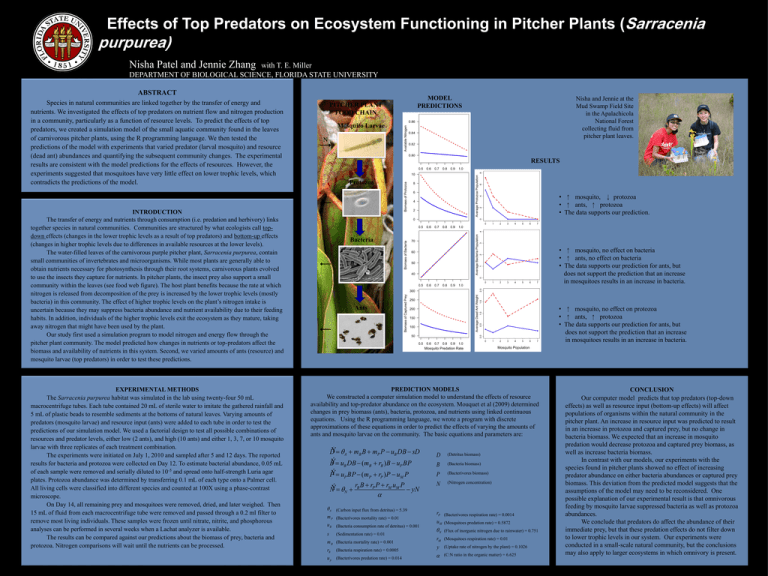
Effects of Top Predators on Ecosystem Functioning in Pitcher Plants (Sarracenia purpurea) Nisha Patel and Jennie Zhang with T. E. Miller DEPARTMENT OF BIOLOGICAL SCIENCE, FLORIDA STATE UNIVERSITY ABSTRACT Species in natural communities are linked together by the transfer of energy and nutrients. We investigated the effects of top predators on nutrient flow and nitrogen production in a community, particularly as a function of resource levels. To predict the effects of top predators, we created a simulation model of the small aquatic community found in the leaves of carnivorous pitcher plants, using the R programming language. We then tested the predictions of the model with experiments that varied predator (larval mosquito) and resource (dead ant) abundances and quantifying the subsequent community changes. The experimental results are consistent with the model predictions for the effects of resources. However, the experiments suggested that mosquitoes have very little effect on lower trophic levels, which contradicts the predictions of the model. PITCHER PLANT FOOD CHAIN Nisha and Jennie at the Mud Swamp Field Site in the Apalachicola National Forest collecting fluid from pitcher plant leaves. Mosquito Larvae N RESULTS Protozoa • mosquito, protozoa • ants, protozoa • The data supports our prediction. INTRODUCTION The transfer of energy and nutrients through consumption (i.e. predation and herbivory) links together species in natural communities. Communities are structured by what ecologists call topdown effects (changes in the lower trophic levels as a result of top predators) and bottom-up effects (changes in higher trophic levels due to differences in available resources at the lower levels). The water-filled leaves of the carnivorous purple pitcher plant, Sarracenia purpurea, contain small communities of invertebrates and microorganisms. While most plants are generally able to obtain nutrients necessary for photosynthesis through their root systems, carnivorous plants evolved to use the insects they capture for nutrients. In pitcher plants, the insect prey also support a small community within the leaves (see food web figure). The host plant benefits because the rate at which nitrogen is released from decomposition of the prey is increased by the lower trophic levels (mostly bacteria) in this community. The effect of higher trophic levels on the plant’s nitrogen intake is uncertain because they may suppress bacteria abundance and nutrient availability due to their feeding habits. In addition, individuals of the higher trophic levels exit the ecosystem as they mature, taking away nitrogen that might have been used by the plant. Our study first used a simulation program to model nitrogen and energy flow through the pitcher plant community. The model predicted how changes in nutrients or top-predators affect the biomass and availability of nutrients in this system. Second, we varied amounts of ants (resource) and mosquito larvae (top predators) in order to test these predictions. EXPERIMENTAL METHODS The Sarracenia purpurea habitat was simulated in the lab using twenty-four 50 mL macrocentrifuge tubes. Each tube contained 20 mL of sterile water to imitate the gathered rainfall and 5 mL of plastic beads to resemble sediments at the bottoms of natural leaves. Varying amounts of predators (mosquito larvae) and resource input (ants) were added to each tube in order to test the predictions of our simulation model. We used a factorial design to test all possible combinations of resources and predator levels, either low (2 ants), and high (10 ants) and either 1, 3, 7, or 10 mosquito larvae with three replicates of each treatment combination. The experiments were initiated on July 1, 2010 and sampled after 5 and 12 days. The reported results for bacteria and protozoa were collected on Day 12. To estimate bacterial abundance, 0.05 mL of each sample were removed and serially diluted to 10-5 and spread onto half-strength Luria agar plates. Protozoa abundance was determined by transferring 0.1 mL of each type onto a Palmer cell. All living cells were classified into different species and counted at 100X using a phase-contrast microscope. On Day 14, all remaining prey and mosquitoes were removed, dried, and later weighed. Then 15 mL of fluid from each macrocentrifuge tube were removed and passed through a 0.2 ml filter to remove most living individuals. These samples were frozen until nitrate, nitrite, and phosphorous analyses can be performed in several weeks when a Lachat analyzer is available. The results can be compared against our predictions about the biomass of prey, bacteria and protozoa. Nitrogen comparisons will wait until the nutrients can be processed. MODEL PREDICTIONS Bacteria • mosquito, no effect on bacteria • ants, no effect on bacteria • The data supports our prediction for ants, but does not support the prediction that an increase in mosquitoes results in an increase in bacteria. Ants • mosquito, no effect on protozoa • ants, protozoa • The data supports our prediction for ants, but does not support the prediction that an increase in mosquitoes results in an increase in bacteria. Mosquito Predation Rate Mosquito Population PREDICTION MODELS We constructed a computer simulation model to understand the effects of resource availability and top-predator abundance on the ecosystem. Mouquet et al (2009) determined changes in prey biomass (ants), bacteria, protozoa, and nutrients using linked continuous equations. Using the R programming language, we wrote a program with discrete approximations of these equations in order to predict the effects of varying the amounts of ants and mosquito larvae on the community. The basic equations and parameters are: DÝ A mB B mP P uB DB sD BÝ u DB (m r )B u BP B B B P PÝ uP BP (mP rP )P uM P rB B rP P rM uM P Ý N N yN D B P N (Detritus biomass) (Bacteria biomass) (Bacterivores biomass) (Nitrogen concentration) A mP uB s (Carbon input flux from detritus) = 5.39 (Bacterivores mortality rate) = 0.01 (Bacteria consumption rate of detritus) = 0.001 (Sedimentation rate) = 0.01 m B (Bacteria mortality rate) = 0.001 rB (Bacteria respiration rate) = 0.0005 u p (Bacterivores predation rate) = 0.014 rP uM N (Bacterivores respiration rate) = 0.0014 rM y (Mosquitoes respiration rate) = 0.01 (Mosquitoes predation rate) = 0.5872 (Flux of inorganic nitrogen due to rainwater) = 0.751 (Uptake rate of nitrogen by the plant) = 0.1026 (C:N ratio in the organic matter) = 6.625 CONCLUSION Our computer model predicts that top predators (top-down effects) as well as resource input (bottom-up effects) will affect populations of organisms within the natural community in the pitcher plant. An increase in resource input was predicted to result in an increase in protozoa and captured prey, but no change in bacteria biomass. We expected that an increase in mosquito predation would decrease protozoa and captured prey biomass, as well as increase bacteria biomass. In contrast with our models, our experiments with the species found in pitcher plants showed no effect of increasing predator abundance on either bacteria abundances or captured prey biomass. This deviation from the predicted model suggests that the assumptions of the model may need to be reconsidered. One possible explanation of our experimental result is that omnivorous feeding by mosquito larvae suppressed bacteria as well as protozoa abundances. We conclude that predators do affect the abundance of their immediate prey, but that these predation effects do not filter down to lower trophic levels in our system. Our experiments were conducted in a small-scale natural community, but the conclusions may also apply to larger ecosystems in which omnivory is present.
