Phylogenies
advertisement
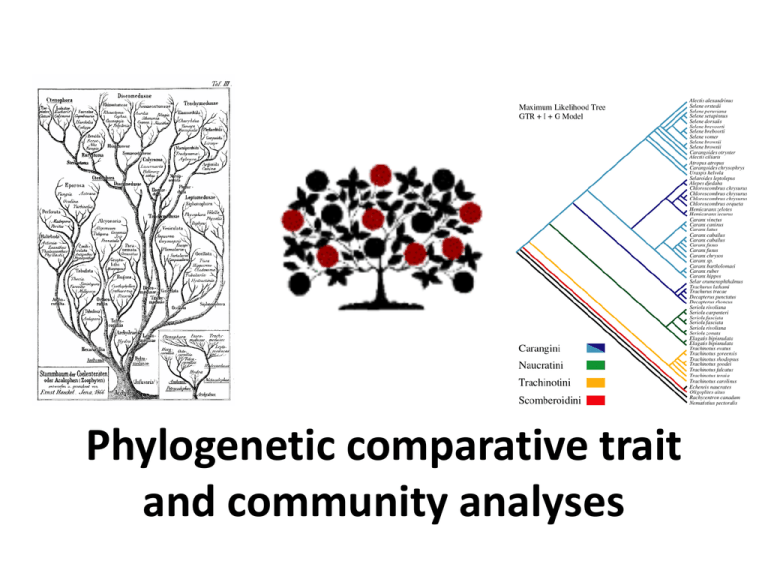
Phylogenetic comparative trait and community analyses Questions • Discussions: – Robbie: posting paper and questions for this week – Vania & Samoa: will be picking a paper to post for week after spring break • Reschedule Monday’s class? – 9:30-10:45 Wed in Benton 240 • Any questions? Ferns Gymnosperms Angiosperms Part 1: Evolutionary trees • • • • What is systematics? What are phylogenies? Why are phylogenies useful? Background information What is systematics? • Systematics is the study of the diversity of organisms and the relationships among these organisms Ways to examine relationships • Evolutionary systematics: Based on similarity as determined by expert (Mayr, Simpson) • Phenetics: Based on overall similarity (Rolf, Sokal, Sneath) • Cladistics: Based on shared derived characters (synapomorphies; Hennig) Ways to examine relationships • Cladistics: Based on synapomorphies – Maximum Parsimony: Form the shortest possible tree (based on minimum steps) – Maximum Likelihood: Based on probability of change in character state and then calculate likelihood that a tree would lead to data (useful for molecular data) – Bayesian Inference: Based on the likelihood that the data would lead to the tree based on prior probabilities assigned using Bayes Theorem Part 1: Evolutionary trees • • • • What is systematics? What are phylogenies? Why are phylogenies useful? Background information What are phylogenies? • Phylogenies are our hypotheses of evolutionary relationships among groups (taxa or taxon for singular) • Graphically represented by trees • When based on shared derived characters = c cladogram a b node 1 ch. 3 ch. 2 node 2 ch. 1 Part 1: Evolutionary trees • • • • What is systematics? What are phylogenies? Why are phylogenies useful? Background information Why are phylogenies useful? • Useful for studying – Evolutionary relationships – Evolution of characters: Correlated (PICs vs. sister pairs), Signal, Partition variation, Ancestral state, Simulations – Types (Brownian vs. OU) and rates of evolution (Homogenous vs. heterogeneous) – Group ages (fossils, biogeography) – Diversity/Diversification: Speciation vs. Extinction? – Biogeographic history – Community phylogenetics – Phyloclimatic modeling and conservation • Assist in – Identification – Classification Part 1: Evolutionary trees • • • • What is systematics? What are phylogenies? Why are phylogenies useful? Background information Background information • • • • Trees Characters Groups Other Trees • Tips: Living taxa • Nodes: Common ancestor • Branches: Can represent time since divergence • Root: Common ancestor to all species in study a b c tips node 1 branch root node 2 Trees • Sister group: Closest relative to a taxon – c and d are sister – b = sister to c,d – a = sister to b,c,d a b c d Trees • Our goal is to make bifurcating trees • But a polytomy is when we are unable to resolve which are the sister taxa (hard vs. soft) a b c d Trees • Phylogenetic trees can be rotated around their nodes and not change the relationships d a b c d b c a Trees • Toplogy: shape • Branch lengths: differentiation (e.g., 1 = punctuated, speciational) or time = ultrametric Characters • Characters: Attribute (e.g., morphological, genetic) – Eye color – Production of flowers – Position 33 in gene X • Character state: Value of that character – Blue, green, hazel, brown – Yes, No – A, T, G, C Picking Characters • • • • Variable Heritable Comparable (homologous) Independent Characters • Homology: A character is homologous in > 2 taxa if found or derived from their common ancestor 1 1 1 or 1’ homologous Homology • Homology is determined by: – Similar position or structures – Similar during development – Similar genetically – Evolutionary character series (transformational homology) from ancestor to descendents Characters • Homoplasy: A character is homoplasious in > 2 taxa if the common ancestor did not have this character 1 1 0 analogous Homoplasy • Due to – Convergent evolution: Similar character states in unrelated taxa – Reversals: A derived character state returns to the ancestral state Characters • Apomorphy: Derived character • Pleisiomorphy: Ancestral character a b c ch. 2 ch. 1 Characters • Synapomorphy: Shared derived character • Autapomorphy: Uniquely derived character • Symplesiomorphy: Shared ancestral character 1,4,5 a 1,2,3,4 b ch. 4 ch. 5 ch. 4 1,2,3,6 c ch. 6 node 1 ch. 3 ch. 2 node 2 ch. 1 chs. 2, 3 = Synapomorphies chs. 5, 6 = Autapomorphies ch. 1 = Symplesiomorphy ch. 4 = False synapomorphy Monophyletic groups • Monophyletic groups: Contain the common ancestor and all of its descendents • What are the monophyletic groups? –c,d –b,c,d –a,b,c,d a b c d Other groups (not recognized) • Paraphyletic groups: Contain the common ancestor and some of its descendents a b c d ch. 1 Based on sympleisiomorphic character Other groups (not recognized) • Polyphyletic groups: Descendants with 2 or more ancestral sources a Based on false synapomorphy b c d ch. 4 e Getting trees • From the literature, Phylomatic, Genbank, collect data yourself (may need name scrubbing tools: Phylomatic, TaxonScrubber) – Methods for assembly: Supertree, Supermatrix, Megatree, Zip them together – Getting the topology vs. getting branch lengths? – Discord among trees based on different characters? Gene trees vs. species trees Storing trees • • • • Newick: ((b:1, c:1), a:1):1; Nexus (output of Paup) Pagel Distance matrix a b c a b c a 0 3 3 b 3 0 2 c 3 2 0 Part 2: Hypothesis Testing Using Evolutionary Trees Part 2: Hypothesis testing http://treetapper.org/, http://cran.r-project.org/web/views/Phylogenetics.html • What sort of hypotheses can we test? – Phylogeography – Evolutionary dating – Phylogenetic community structure – Coevolution/Cospeciation – Mapping characters • • • • Types of characters Correlated Change Dependent Change Phylogenetic Signal When do we need to use phylogenies? • Is it always necessary in ecological questions? – Yes, taxa are not independent points so we must “correct for” phylogeny – Sometimes, it is interesting to “incorporate” phylogenetic hypotheses to see how they influence our analyses – No, evolutionary questions can be asked by incorporating phylogenies but each species represents a separate successful event and should be analyzed with that in mind Part 2: Hypothesis testing • What sort of hypotheses can we test? – Phylogenetic community structure – Mapping characters • • • • Types of characters Correlated Change Dependent Change Phylogenetic Signal Phylogenetic Community Structure • Webb (2000) tested the alternate hypotheses that co-occurring species are (1) more or (2) less closely related than a random assembly of species • He examined the phylogenetic structure in 28 plots in 150 ha of Bornean forest Phylogenetic Community Structure • He found species were more closely related than a random distribution Phylogenetic Community Structure • Recent development of metrics: • • • • NRI, NTI, PSV, PSC Do you use abundance or presence/absence? What regional pool do you compare to? What null models should you use? Part 2: Hypothesis testing • What sort of hypotheses can we test? – Phylogenetic community structure – Mapping characters • • • • Types of characters Correlated Change Dependent Change Phylogenetic Signal Mapping Characters • Once we have a known phylogeny, we can map on characters of interest to test hypotheses • The phylogeny must be built on characters independent of those of interest Types of Characters • If we have a character that appears in a number of taxa, we may – Test the alternate hypotheses that it is (1) analogous or (2) homologous – Test hypotheses as to which state is ancestral and derived • We can map the character onto the phylogeny to test these hypotheses Homologous vs. Analogous Characters Part 2: Hypothesis testing • What sort of hypotheses can we test? – Phylogenetic community structure – Mapping characters • • • • Types of characters Correlated Change Dependent Change Phylogenetic Signal Correlated Change • Comparative biologists often try to test hypotheses about the relationships between two or more characters by taking measurements across many species Branch size – Seed size and seedling size – Body mass and surface area – Fruit size and branch size Fruit size Correlated Change • We might want to ask whether the correlation between traits is due to repeated coordinated evolutionary divergences • We might expect closely related species to resemble one another Correlated Change Branch size • If our phylogeny looked something like this • Then all of the change is really the result of one evolutionary event Fruit size Correlated Change • To incorporate phylogeny into comparative analyses, looking for correlated change, we can use – Sister pairs analyses – Felsenstein’s Independent Contrasts – Grafen’s Phylogenetic regression (ML and Bayesian approaches too) – Pagel’s Discrete and Multistate (Change in character state) Sign test: 32 of 45 are negative (p < 0.01) Strychnos 3 2 1 Hamelia 0 Miconia -1 trees & lianas shrubs Correlated Change • To incorporate phylogeny into comparative analyses, looking for correlated change, we can use – Sister pairs analyses – Felsenstein’s Independent Contrasts (Brownian) – Grafen’s Phylogenetic regression (Other models) • ML and Bayesian approaches too – Pagel’s Discrete and Multistate (Change in character state) Independent Contrasts Character 2 A B C D Character 1 Character 2 20 10 10 40 2 100 4 120 150 100 50 0 0 10 20 Character 1 30 Independent Contrasts Ch 1 Ch 2 20 10 10 40 2 100 4 120 A B C D 5 10 5 E 5 10 Red = Branch Lengths F 15 G X = Character Values, V = Branch Length Values Independent Contrasts • Contrasts values: Ck = Xi – Xj Vi + Vj • Ancestral Values: Xk = Vj Xi + Vi Xj Vi + Vj • Branch Length: V’k = Vk + Vi Vj Correction Vi + Vj X = Character Values, V = Branch Length Values Independent Contrasts Ch 1 Ch 2 20 10 10 40 2 100 4 120 A B C D 5 10 5 E 5 10 Red = Branch Lengths F 15 G X = Character Values, V = Branch Length Values Independent Contrasts CE1 = 4 - 2 = 2 = 0.63 5 + 5 10 CE2 = 120 - 100 = 20 = 6.32 5+5 10 XE1 = 5 * 4 + 5 * 2 = 10 + 20 = 3 5+5 10 XE2 =5 * 120 + 5 * 100 =600 + 500=110 5+5 10 Ch 1 Ch 2 V’E = 10 + 5 * 5 = 10 + 25 = 12.5 5+5 10 2 100 4 120 C D 5 X = Character Values, V = Branch Length Values 5 E 10 Independent Contrasts CF1 = 3 - 10 = -7 = -1.5 10 + 12.5 22.5 CF2 = 110 - 40 = 70 = 14.8 10 + 12.5 22.5 XF1=10 * 3 +12.5 * 10=30 +125 =6.9 10 + 12.5 22.5 XF2=10*110+12.5 *40=1100 +500=71.1 10 + 12.5 22.5 Ch 1 Ch 2 V’F =15 + 10 * 12.5 =15 + 125 =20.6 10 + 12.5 22.5 10 40 3 110 B 10 E 12.5 X = Character Values, V = Branch Length Values F 15 Independent Contrasts CG1 = 6.9 - 20 = -13.1 = -2.6 5 + 20.6 25.6 CG2 = 71.1 - 10 = 61.1 = 12.1 5 + 20.6 25.6 XG1=5*6.9+20.6*20=34.5+411=17.4 5 + 20.6 25.6 XG2=5*71.1+20.6 *10=355.5 +206=22 5 + 20.6 25.6 Ch 1 Ch 2 20 10 6.9 71.1 A 5 F X = Character Values, V = Branch Length Values 20.6 G Independent Contrasts Contrast 2 12.1 14.8 6.3 Contrast 2 Contrast 1 E -2.6 F -1.5 G 0.6 20 10 0 -4 -2 0 Contrast 1 Note: these should be fit through the origin 2 Independent Contrasts Ch 1 Ch 2 20 10 Character 2 A 10 40 2 100 4 120 B C D 5 150 100 50 0 10 0 10 20 30 E 5 10 Contrast 2 Character 1 20 F 10 G F E 15 0 G -4 -2 0 Contrast 1 2 5 Part 2: Hypothesis testing • What sort of hypotheses can we test? – Phylogenetic community structure – Mapping characters • • • • Types of characters Correlated Change Dependent Change Phylogenetic Signal Dependent Change • We find that two characters show correlated change • We might hypothesize that change in one character is dependent on the state of a second character • This can be tested easily on discrete characters – Seed size and disperser size Dependent Change Part 2: Hypothesis testing • What sort of hypotheses can we test? – Phylogenetic community structure – Mapping characters • • • • Types of characters Correlated Change Dependent Change Phylogenetic Signal Phylogenetic Signal • We may want to test the alternate hypotheses that (1) the evolutionary history or (2) the recent ecological pressures most strongly influence species’ characters • We can examine the amount of “phylogenetic signal” (whether two closely related species are more similar than two random species) for a character Phylogenetic Signal Y Strong correlation with phylogeny Weak correlation with phylogeny Phylogenetic Signal • Ackerly: Based on PICs (randomizing across the tree) • Pagel’s lambda • Blomberg’s K: K<1 (overdispersed), K=1 (Brownian random), K>1 (clustered) • Mantel tests: distance based Partitioning variation • Previously done with Taxonomic Hierarchical ANOVA (e.g., the Family, Genus, Species levels) – This assumes that Families are equivalent units • But instead the % variation in a trait can be calculated for each node and compared across the tree
