Neuropil Distribution in the Anterior Cingulate and
Primary Visual Cortex of Cetartiodactyla, Primates, and Afrotheria
2
1
2
3
Amy Nguyen, Nina Patzke, Kathleen Bitterman, Paul Manger, and Muhammad Spocter
2,3
(1) College of Pharmacy and Health Sciences, Drake University (2) School of Anatomical Sciences, The University of Witwatersrand (3) Deparment of Anatomy, Des Moines University
ABSTRACT
The Ceratriodactyla contain a great diversity in brain morphology and behavior as
exemplified by the elaborate behavioral repertoire of the bottlenose dolphin. Despite
this, little is known about species-specific variation in neuronal packing, connectivity,
1
and variation in neuropil space for this clade. Using image analysis techniques, the
neuropil fraction (NF) in the anterior cingulate cortex (ACC), and the primary visual
cortex (OCC) in layers I-VI of the cerebral cortex was quantified to identify species and
regional differences in connectivity. It is2 believed that qualitative differences in
connectivity underlie behavioral differences between species. Given the role of the ACC
as a component
of the limbic system involved in the emotional aspects of motivating and
3
initiating goal-directed behaviors, it is argued that modifications in the neuropil are
responsible for some of the complex behaviors exhibited by the members of this group.
The study examines the NF in the ACC and OCC across 18 mammalian species.
MATERIALS & METHODS
Specimens and histological preparation
The brains of eighteen adult mammalian species of unknown sex were used in this
current study (Fig. 1). All animals were euthanized and brain specimens harvested
during necropsy, with permission and guidelines from the University of the
Witwatersrand Animal Ethics Committee and in accordance with comparable
provisions from the NIH. After harvesting, whole brains were submerged in 4%
until
further processing.
formaldehyde
solution
Chlorocebus aethiops (vervet mo n k e y ) Primates
Catarrhini
Vm
H o m o sapiens ( h u ma n s) *not u s e d in study
Platyrrhini
Saimiri sciureus (squirrel m o n k e y ) Sqm
Cere
b
White Matter
Olf
4
0.9
OCC
Artiodactyls
0.8
Image analysis
The neuropil fraction (NF) was sampled in Nissl sections in layers I to VI by quantifying
the relationship between the proportion of unstained and stained cellular elements.
Using the StereoInvestigator program, contours were drawn around the region of
interest at 2X magnification and fractionator sampling was used to randomly sample
digital images at 20X magnification (Fig. 3). Image stacks consisting of approximately
20 images per section were collected and converted into a series of 8 bit grayscale
image frames. The following parameters describe the sampling design: grid spacing
1000 μm X 1000 μm; an average target intensity of 71%; image size 1600 x 1200
pixels, resolution 0.37 pixels per μm.
4
0.7
Hippopotamus
0.6
4
0.5
Primates
0.4
4
0.3
Whales
0.2
0.1
0.0
Fig. 3- An example of the
image sampling method
used for estimating the
neuropil fraction. Section
through the ACC in
Trichechus senagalensis.
C a p r a ibex (alpine ibex)- Ci
0.9
AM CD Ci Ct HA Ss Ba M3 Pt Sqm Tm VM Gs Sc TA TS Dp Cg
B a l a e n o p t e r a a c u t o r o s t r a t a (m i n k e w h a l e ) Ba
Suidae
Camelidae
Macroscelididae
Afrotheria
H e x a p r o t o d o n l ib e r ie n s is ( p y g m y hi p p o ) - H a
ACC
0.8
0.7
0.6
0.5
0.4
C a m e l u s d r o m e d a r iu s (camel)- C d
S u s s c r o f a (wild boar ) - S s
Trichechus manatus (manatee)-
Trichechidae
Fig. 4 - Example of
Petrodromus tetradactylus (shrew)-Pt
TT m
r i ,c M
h e3 c h u s s e n e g a l e n s i s ( m a n a t e e ) - T s
pixels
NF =
+
the image conversion
pixels from grey scale to binary
and NF equation.
0.3
0.2
0.1
0.0
AM CD Ci Ct HA Ss Ba M3 Pt Sqm Tm VM Gs Sc TA TS Dp Cg
Blocks of the occipital and frontal lobes, containing the OCC and the ACC
respectively, were removed with a coronal cut at the level of the precentral gyrus
rostrally and a further cut at the level of the angular gyrus caudally (Fig. 2). Tissue
blocks were cryoprotected by immersion with increasing concentrations of sucrose
solutions up to 30%. Blocks were covered with sucrose, frozen on a slur of dry ice,
and sectioned at 50μm using a sliding microtome. A 1:10 series of sections was
stained for Nissl substance with a solution of 0.5% cresyl violet.
Sig.
0.010
0.018
0.014
0.018
0.010
0.016
0.012
0.016
0.018
0.016
0.019
0.022
0.014
0.012
0.019
0.019
1.00E+00
5.81E-05
1.90E-17
2.89E-09
1.00E+00
1.71E-07
2.20E-19
4.63E-09
5.81E-05
1.71E-07
2.33E-21
5.54E-15
1.90E-17
2.20E-19
2.33E-21
1.00E+00
0.018
0.016
0.022
0.019
2.89E-09
4.63E-09
5.54E-16
1.00E+00
DISCUSSION
CONCLUSION
Fig. 5 - Regional variation in measurements of neuropil
fraction (NF) in the 18 species according to the methods
used in this study. Bar graphs of the mean neuropil fraction
by cortical area. Error bars indicate standard error.
In conclusion, all eighteen species display a higher neuropil fraction in the anterior
cingulate cortex in comparison to that observed in the primary visual cortex. Species
with complex socio-cognitive behaviors may have evolved different mechanisms to
support these functions. Further studies are required to identify specific adaptations
in the ACC, especially in the much understudied hippopotamus due to its surprisingly
high NF values.
Betweengroups df
Acknowledgments
This work was funded by a National Research Foundation (NRF) grant to Dr. Paul Manger and an
IOER-FAC startup grant awarded to Dr. Muhammad Spocter.
.
Fig. 1 - Phylogenetic relationships of the species used in the current study.
Statistical analysis
All analyses were undertaken using the NF calculated for each section from the series of
six sections sampled by region and species. The data was placed into an Excel worksheet and imported into SPSS Statistical Software package Version 22.0 for statistical
comparison of significant differences in mean values. A Repeated Measures Analysis
of Variance (ANOVA) with species as the between-subjects factor and brain
region as the within-subjects factor was conducted. All graphs were plotted using the
graphing function in PAST (version 1.18; PAST © Hammer et al., 2001).
0.014
-0.086*
0.152*
0.126*
-0.014
-0.100*
0.139*
0.112*
0.086*
0.100*
0.238*
0.211*
0.211*
-0.152*
-0.139*
-0.238*
-0.027
-0.112*
-0.211*
0.027
b
Std. Error
The increased connectivity observed in the ACC relative to the OCC supports our
understanding of the ACC and its role in the limbic system. We would hypothesize that
regional variation in neuropil space is indicative of behavioral differences supporting
socio-cognitive functions relevant for each species. The contradiction within primates
and cetaceans
can be explained by modifications in neural circuitry. The study by Peters
6
and Yilmaz identified smaller minicolumn widths in primates, and we argue that the
reduction of minicolumn widths, and in effect, smaller NF, allowed for specialization in
the cortical microcircuitry. Identification of specialized modules in the primary visual
cortex of primates7 supports the idea of modifications.
The hippopotamus has on average, the largest neuropil space sampled to date;
however, its aggressiveness makes studying its behavior and sociality difficult. In the
absence of a full chemoarchitectural analysis and reconstruction of neuronal complexity,
the behavioral complexity of the hippopotamus is relatively unknown. The use of the
pygmy hippopotamus in the study is not representative of H. amphibius, and
comparative studies such as these are limited by tissue availability and the
“endangered status” of some of these species.
Gazella subgutturosa (goitered gazelle)- G s
Image frame acquisition was monitored during fractionator sampling, and all frames that
fell outside of the region of interest boundaries were omitted. Each image series was
imported into Image J (v.1.32j). Each series was subjected to background subtraction
and then converted to binary by an automated threshold routine (Fig. 4).5 The percentage
of the measuring frame occupied by pixels representing unstained elements was
calculated and used to determine the NF using the equation below (Fig. 4).
Artiodactyls
Hippopotamus
Primates
Whales
Afrotheria
Hippopotamus
Primates
Whales
Afrotheria
Artiodactyls
Primates
Whales
Afrotheria
Artiodactyls
Hippopotamus
Whales
Afrotheria
Artiodactyls
Hippopotamus
Primates
Difference
(I-J)
Table 2. Pairwise Comparisons. Highlighted areas indicate a significant difference.
1.0
Antidorcas marsupialis (springbok)- A m
Tragelaphus angasii (nyala)- T a
4
Afrotheria
Fig. 2 - Schematic illustrating the cortical areas where the neuropil was sampled.
Damaliscus pygargus (blesbok)- D p
S y n c e r u s caffer (African buffalo)- S c
Comparison
Groups
1.0
C o n n o c h a e t e s taurinus (blue wildebest)- C t
Cetartiodactyla
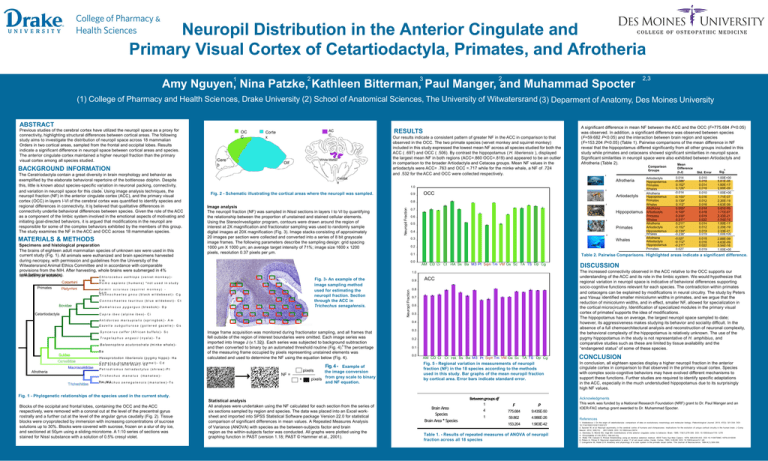
Our results indicate a consistent pattern of greater NF in the ACC in comparison to that
observed in the OCC. The two primate species (vervet monkey and squirrel monkey)
included in this study expressed the lowest mean NF across all species studied for both the
ACC ( .697) and OCC ( .506). By contrast the hippopotamus ( H. liberiensis ), displayed
the largest mean NF in both regions (ACC=.860 OCC=.819) and appeared to be an outlier
in comparison to the broader Artiodactyla and Cetacea groups. Mean NF values in the
artiodactyls were ACC= .763 and OCC =.717 while for the minke whale, a NF of .724
and .532 for the ACC and OCC were collected respectively.
A significant difference in mean NF between the ACC and the OCC (F=775.684 P<0.05)
was observed. In addition, a significant difference was observed between species
(F=59.682 P<0.05) and the interaction between brain region and species
(F=153.204 P<0.05) (Table 1). Pairwise comparisons of the mean difference in NF
reveal that the hippopotamus differed significantly from all other groups included in this
study while primates and cetaceans showed significant similarities in neuropil space.
Significant similarities in neuropil space were also exhibited between Artiodactyls and
Afrotheria (Table 2).
Mean
Caudat
e
C o n n o c h a e t e s g n o u (black wildebeest)- C g
Bovidae
RESULTS
AC
C
Corte
x
Neuropil Fraction
BACKGROUND INFORMATION
OC
C
Neuropil Fraction
Previous studies of the cerebral cortex have utilized the neuropil space as a proxy for
connectivity, highlighting structural differences between cortical areas. The following
study aims to investigate the distribution of neuropil space across 18 mammalian
Orders in two cortical areas, sampled from the frontal and occipital lobes. Results
indicate a significant difference in neuropil space between cortical areas and species.
The anterior cingulate cortex maintained a higher neuropil fraction than the primary
visual cortex among all species studied.
Brain Area
Species
Brain Area * Species
1
F
P
4
775.684
9.435E-50
1
59.862
4.986E-26
153.204
1.963E-42
Table 1. - Results of repeated measures of ANOVA of neuropil
fraction across all 18 species
References
1. Vislobokova I. On the origin of cetartiodactyla: comparison of data on evolutionary morphology and molecular biology. Paleontological Journal. 2013; 47(3): 321-334. DOI
10.11341500310301130312Y
2. Spocter M, et al. Neuropil asymmetry in the cerebral cortex of humans and chimpanzees: implications for the evolution of unique cortical circuitry in the human brain. J Comp
Neurol. 2012; 520(13): 2917-2929. DOI: 10.1002/cne.23074
3.. Devinsky O, Morrel MJ, Vogt BA. Contributions of the anterior cingulate cortex to behavior. Brain. 1995; 118(1):279-306. DOI: 10.1093/brain/118.1.279
4. Encyclop. edia of Life (EOL). http:eol.org
5. Rider TW , Calvard S. Picture thresholding using an iterative selection method. IEEE Trans Sys Man Cybern. 1978; 8(8):630-632. DOI 10.1109/TSMC.1978.4310039
6. Peters A, Yilmaz E. Neuronal organization in area 17 of cat visual cortex. Cereb. Cortex. 1993; 3:49-68. DOI: 10.1093/cercor/3.1.49
7. Livingstone M, Hubel D.H. Anatomy and physiology of a color system in the primate visual cortex. The Journal of Neuroscience. 1984:4(1):309-356.


