Document
advertisement
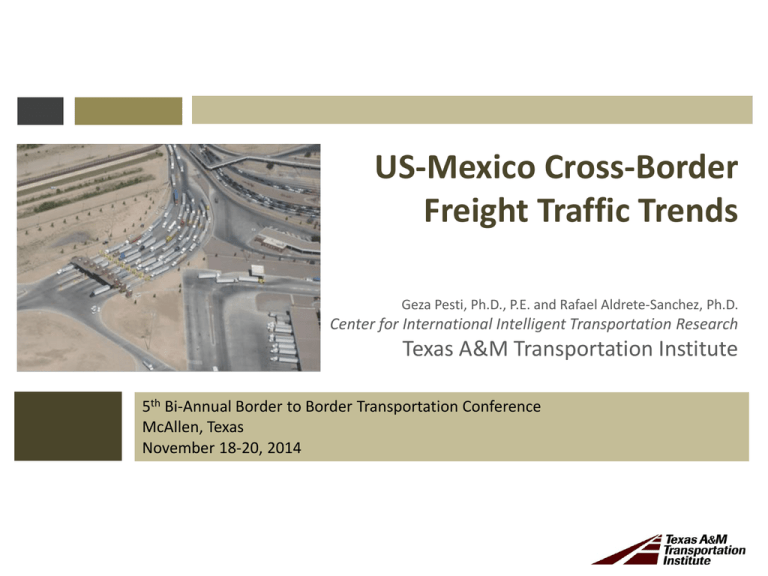
US-Mexico Cross-Border Freight Traffic Trends Geza Pesti, Ph.D., P.E. and Rafael Aldrete-Sanchez, Ph.D. Center for International Intelligent Transportation Research Texas A&M Transportation Institute 5th Bi-Annual Border to Border Transportation Conference McAllen, Texas November 18-20, 2014 Objectives • Update trends and statistics in freight activities across the USMexico border • Identify unexpected changes. Approach Analyze cross-border freight by • Mode of transport • Ports and destination states • Commodities • Average Wait Times of Commercial Vehicles at POEs Surface Trade between U.S. and Mexico 19% 28% 23% 18% 11% 13% 12% 7% 5% 0% 500 -5% 15% 13% 10% 2% 1% -1% -14% 300 2007 Global Financial Crisis 200 Early 2000s Recession 100 2013 2012 2011 2010 2009 2008 2007 2006 2005 2004 2003 2002 2001 2000 1999 1998 1997 1996 0 1995 Billions USD 400 Surface Trade between U.S. and Mexico 250 Imports Exports 150 Exports 44% 100 Imports 56% 50 2013 2012 2011 2010 2009 2008 2007 2006 2005 0 2004 Billions USD 200 Trade by Surface Mode IMPORT 250 Other 5% Other 2% Rail 15% Rail 16% Truck 82% Truck 80% 2013 2012 2011 Rail 2009 2006 2013 2008 2012 0 2011 0 2010 50 2009 50 2007 100 2006 100 2005 150 2004 150 Truck 2010 200 2008 Rail 2005 Truck 200 (Billions USD) 2007 (Billions USD) 2004 250 EXPORT Texas California Michigan 22.5% Illinois 2005 2006 2007 2008 2009 2010 2011 2012 2013 2005 2006 2007 2008 2009 2010 2011 2012 2013 50,000 2005 2006 2007 2008 2009 2010 2011 2012 2013 100,000 2005 2006 2007 2008 2009 2010 2011 2012 2013 200,000 2005 2006 2007 2008 2009 2010 2011 2012 2013 Millions USD Surface Trade by US States States Ranked Based on Value of Goods Traded with Mexico 0.5 % 150,000 -3.5% 7.9% 8.4% 0 Arizona Freight Flow by Commodities Change in the freight value was evaluated based on six commodity groups: • Group 1: Food, beverages, agricultural commodities (HS-code: 1-24) • Group 2: Minerals, chemicals, plastic, fossil fuels (HS-code: 25-40) • Group 3: Wood, fabrics, paper products, books (HS-code: 41-71) • Group 4: Metals, metallic materials (HS-code: 72-81) • Group 5: Manufactured goods (HS-code: 82-96) • Group 6: Other goods (HS-code: 97-99) Export by Commodity Groups Laredo, TX 0 10 20 30 40 El Paso 50 60 70 0 10 20 30 Hidalgo Otay Mesa 0 0 10 10 20 Nogales 0 10 Food, beverages, agricultural commodities Minerals, chemicals, plastic, fossil fuels 2007 2008 Wood, fabrics, paper products, books Metals, metallic goods 2009 2010 2011 2012 2013 Manufactured goods Other goods Import by Commodity Groups Laredo, TX 0 10 20 30 40 Hidalgo El Paso 50 60 70 0 10 20 30 0 10 Otay Mesa 0 10 20 Nogales 0 10 Food, beverages, agricultural commodities Minerals, chemicals, plastic, fossil fuels 2007 2008 Wood, fabrics, paper products, books Metals, metallic goods 2009 2010 2011 2012 2013 Manufactured goods Other goods Import of Manufactured Goods Laredo, TX Billion USD 0 1 2 3 4 5 6 Nuclear reactors; boilers; machinery and mechanical appliances; parts thereof Electrical machinery and equipment and parts thereof; Sound recorders and reproducers Vehicles; other than railway or tramway rolling stock; and parts and accessories thereof Optical; photographic; cinematographic; measuring; checking; precision; medical instruments 2007 2008 2009 2010 2011 2012 2013 Import of Minerals, Chemicals, …etc Laredo, TX 0 2 Billion USD 4 Mineral fuels; mineral oils and products of their distillation; Bituminous substances; Mineral… Inorganic chemicals; Organic or inorganic compounds of precious metals; of rare-earth… Organic chemicals Pharmaceutical products Tanning or dyeing extracts; Tannins and their derivatives; Dyes; pigments and other… Essential oils and resinoids; Perfumery; cosmetic or toilet preparations Soap; organic surface-active agents; washing preparations; lubricating preparations;… Albuminoidal substances; Modified starches; Glues; Enzymes Photographic or cinematographic goods Miscellaneous chemical products Plastics and articles thereof Rubber and articles thereof 2007 2008 2009 2010 2011 2012 2013 6 8 Average Waiting Times of Commercial Vehicles Data Collection Period: May 2013 – April 2014 Source: Border Crossing Information System (http://bcis.tamu.edu/) Zaragoza World Trade minutes 0 Pharr minutes 10 20 30 40 50 60 0 minutes 0 10 20 30 40 50 60 SUN SUN SUN MON MON MON TUE TUE TUE WED WED WED THU THU THU FRI FRI FRI SAT SAT SAT Colombia Brownsville minutes 0 BOTA minutes 10 20 30 40 50 60 0 10 20 30 40 50 60 minutes 0 10 20 30 40 50 60 SUN SUN SUN MON MON MON TUE TUE TUE WED WED WED THU THU THU FRI FRI FRI SAT SAT SAT 10 20 30 40 50 60 Summary Findings • • • • Trade has quadrupled from 1995 to 2013. Imports exceeded U.S. exports by 15-20 %. Freight by trucks are 4-5 times higher than rail Freight at Texas POEs is more than in the other three states combined. • Manufactured goods are the highest value commodity shipped across the border (both ways). • Import of manufactured goods has significantly decreased in 2013. • Import of minerals, chemicals, plastic, fossil fuels has significantly increased in 2013.
