BPA_research_poster
advertisement

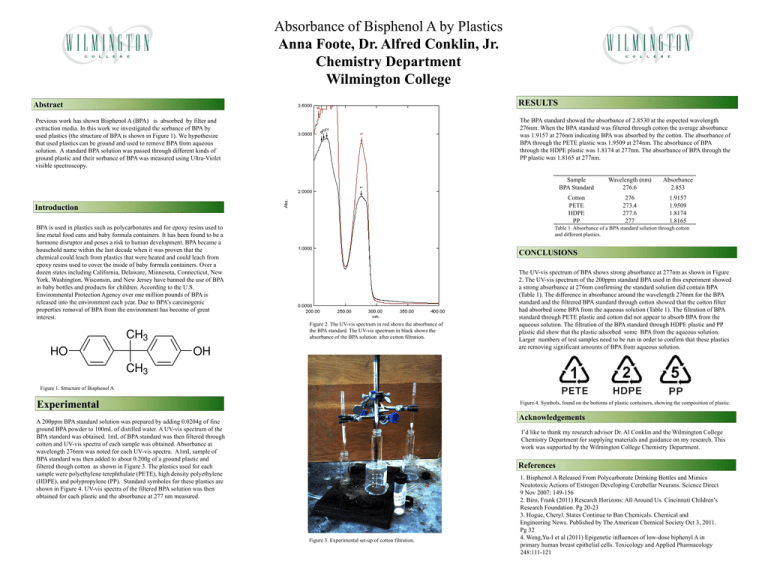
Absorbance of Bisphenol A by Plastics Anna Foote, Dr. Alfred Conklin, Jr. Chemistry Department Wilmington College RESULTS Abstract The BPA standard showed the absorbance of 2.8530 at the expected wavelength 276nm. When the BPA standard was filtered through cotton the average absorbance was 1.9157 at 276nm indicating BPA was absorbed by the cotton. The absorbance of BPA through the PETE plastic was 1.9509 at 274nm. The absorbance of BPA through the HDPE plastic was 1.8174 at 277nm. The absorbance of BPA through the PP plastic was 1.8165 at 277nm. Previous work has shown Bisphenol A (BPA) is absorbed by filter and extraction media. In this work we investigated the sorbance of BPA by used plastics (the structure of BPA is shown in Figure 1). We hypothesize that used plastics can be ground and used to remove BPA from aqueous solution. A standard BPA solution was passed through different kinds of ground plastic and their sorbance of BPA was measured using Ultra-Violet visible spectroscopy. Introduction BPA is used in plastics such as polycarbonates and for epoxy resins used to line metal food cans and baby formula containers. It has been found to be a hormone disruptor and poses a risk to human development. BPA became a household name within the last decade when it was proven that the chemical could leach from plastics that were heated and could leach from epoxy resins used to cover the inside of baby formula containers. Over a dozen states including California, Delaware, Minnesota, Connecticut, New York, Washington, Wisconsin, and New Jersey have banned the use of BPA in baby bottles and products for children. According to the U.S. Environmental Protection Agency over one million pounds of BPA is released into the environment each year. Due to BPA’s carcinogenic properties removal of BPA from the environment has become of great interest. Sample BPA Standard Wavelength (nm) 276.6 Absorbance 2.853 Cotton PETE HDPE PP 276 273.4 277.6 277 1.9157 1.9509 1.8174 1.8165 Table 1. Absorbance of a BPA standard solution through cotton and different plastics. CONCLUSIONS Figure 2. The UV-vis spectrum in red shows the absorbance of the BPA standard. The UV-vis spectrum in black shows the absorbance of the BPA solution after cotton filtration. The UV-vis spectrum of BPA shows strong absorbance at 277nm as shown in Figure 2. The UV-vis spectrum of the 200ppm standard BPA used in this experiment showed a strong absorbance at 276nm confirming the standard solution did contain BPA (Table 1). The difference in absorbance around the wavelength 276nm for the BPA standard and the filtrered BPA standard through cotton showed that the cotton filter had absorbed some BPA from the aqueous solution (Table 1). The filtration of BPA standard through PETE plastic and cotton did not appear to absorb BPA from the aqueous solution. The filtration of the BPA standard through HDPE plastic and PP plastic did show that the plastic adsorbed some BPA from the aqueous solution. Larger numbers of test samples need to be run in order to confirm that these plastics are removing significant amounts of BPA from aqueous solution. Figure 1. Structure of Bisphenol A Experimental Figure 4. Symbols, found on the bottoms of plastic containers, showing the composition of plastic. Acknowledgements A 200ppm BPA standard solution was prepared by adding 0.0204g of fine ground BPA powder to 100mL of distilled water. A UV-vis spectrum of the BPA standard was obtained. 1mL of BPA standard was then filtered through cotton and UV-vis spectra of each sample was obtained. Absorbance at wavelength 276nm was noted for each UV-vis spectra. A1mL sample of BPA standard was then added to about 0.200g of a ground plastic and filtered though cotton as shown in Figure 3. The plastics used for each sample were polyethylene terephthalate (PETE), high density polyethylene (HDPE), and polypropylene (PP). Standard symboles for these plastics are shown in Figure 4. UV-vis spectra of the filtered BPA solution was then obtained for each plastic and the absorbance at 277 nm measured. I’d like to thank my research advisor Dr. Al Conklin and the Wilmington College Chemistry Department for supplying materials and guidance on my research. This work was supported by the Wilmington College Chemistry Department. References Figure 3. Experimental set-up of cotton filtration. 1. Bisphenol A Released From Polycarbonate Drinking Bottles and Mimics Neutotoxic Actions of Estrogen Developing Cerebellar Neurans. Science Direct 9 Nov 2007: 149-156 2. Biro, Frank (2011) Research Horizons: All Around Us. Cincinnati Children’s Research Foundation. Pg 20-23 3. Hogue, Cheryl. States Continue to Ban Chemicals. Chemical and Engineering News. Published by The American Chemical Society Oct 3, 2011. Pg 32 4. Weng,Yu-I et al (2011) Epigenetic influences of low-dose biphenyl A in primary human breast epithelial cells. Toxicology and Applied Pharmacology 248:111-121 printed by www.postersession.com


