Australian Upstream The Dilemma with Growth
advertisement
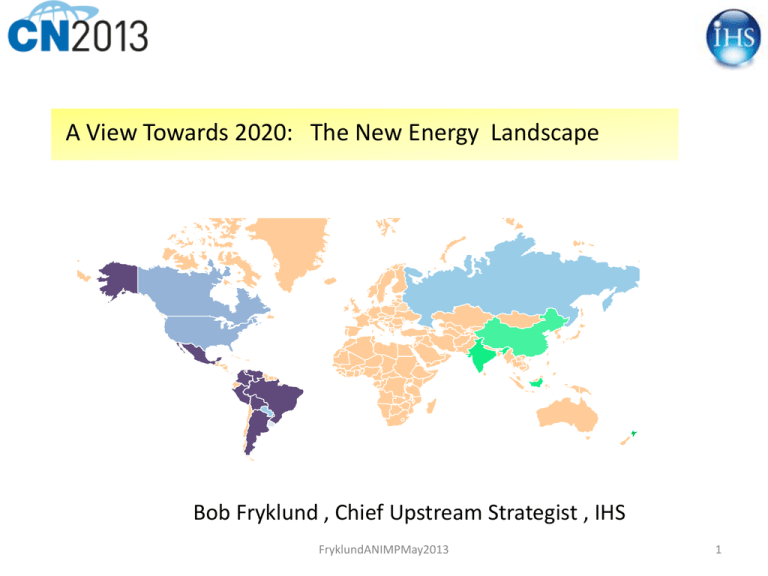
A View Towards 2020: The New Energy Landscape Bob Fryklund , Chief Upstream Strategist , IHS FryklundANIMPMay2013 1 The North American Renaissance 2 FryklundANIMPMay2013 First Wave-- The Shale Gale ! September 2012 64.7 Bcf per day Henry Hub monthly average cash price NGL- and oil-rich plays begin to drive third wave Avg $7.45 Jan 04 to Dec 08 July 2008 56.1 Bcf per day Haynesville, Marcellus shale plays drive second wave Shale Gale starts with Avg $3.75 Barnett, Fayetteville, Jan 09 to Sept. 12 and Woodford shale plays Hurricane Ike Hurricanes Katrina, Rita Source: IHS CERA, Intelligence Press, andFryklundANIMPMay2013 EIA. 3 Inn of America No Room FryklundANIMPMay2013 4 Global LNG supply is diversifying geographically Australia Qatar Indonesia Algeria Malaysia Nigeria Trinidad Egypt Oman Russia USA Brunei Yemen Papua New Guinea Abu Dhabi Angola Peru Norway Equatorial Guinea Libya Canada Mozambique Iran Iraq Cameroon Brazil Israel Venezuela Tanzania TOTAL Inventory: 845 mt Existing, 279 mt Committed, 95 mt Proposed, 472 mt N.B. An "inventory" of projects, not an outlook. Proposed projects have varying degrees of likelihood. 0 Source: IHS CERA. Note: mt = million metric tons. 20 40 60 80 100 Million Tons per Year FryklundANIMPMay2013 120 140 160 5 Second Wave - U.S. Liquids Revival mmboe/d U.S. Oil and NGL Production: 1960 – 2020* • Reversing a trend that spanned the previous four decades, U.S. liquids production is expected to regain and overtake its 1970 peak by 2020. • Driven solely by the growth in tight oil and wet gas plays, total liquids production is expected to reach >11.5 mmboe/d by the end of this decade. • By 2020, tight oil production is on track to reach 4.2 mmboe/d accounting for 36% of total US liquids production (up from 21% in 2012). 14 12 10 8 6 4 2 0 1960 1970 1980 1990 2000 2010 Conventional Oil NGLs Tight Oil 2020 *Forecast numbers are production capacity **Assumes recent high oil prices above $80/bbl are maintained throughout the forecast period 7 FryklundANIMPMay2013 U.S. & Canada Emerge On the World Stage mmb/d 3.5 Top 10 Growth and Decline Countries for 2012-2020 Net Liquids Production Change 3 2.5 2 C 1.5 1 C 0.5 0 -0.5 -1 -1.5 Other countries predominantly unconventional (Canada oil sands), deepwater (Brazil, Angola, Other Africa) or onshore OPEC categories (Iraq, Libya). 8 FryklundANIMPMay2013 North American oil production create higher OPEC spare capacity Year on Year Change in Total Crude Oil Production (Thousand Barrels per Day) Weak “call on OPEC” expected to result in higher OPEC spare capacity and reduce OPEC pricing power FryklundANIMPMay2013 9 A New Map for Global trade flows of crude and refined product We anticipate significant growth in global trade Trade Volumes Thousand Barrels per Day Gasoline Flows Diesel Flows OTPP CONFIDENTIAL FryklundANIMPMay2013 10 North American LPG Exports Ramp Up U.S. Imports and Exports of LPG, Thousand Tonnes per Day mmb/d • Global LPG trade flows are 348 adjusting to accommodate U.S. exports 290 • LPG production outside the 30 Canada Imports Waterborne Imports 25 Mexico Land Exports United States is also rising Waterborne Exports 20 232 15 174 10 116 5 58 0 0 2003 2004 2005 2006 2007 2008 2009 2010 2011 2012 FryklundANIMPMay2013 OTPP CONFIDENTIAL • Demand from international markets will need to expand to consume the new production The Industry Re Structures- Portfolio’s Resource Base by Type, Proven + Non-Proven 100% Arctic * Unconv. Oil & Gas** Deepwater 80% 7% 13% 9% 3% 3% 22% 33% 9% 7% 22% 8% 19% 60% 13% 10% 21% 5% 34% 11% LNG 32% 40% 21% Heavy Oil & Oil Sands 12% 60% 50% 20% 23% Conv. O&G 28% 26% RDS CVX 0% XOM Source: IHS Herold 12 FryklundANIMPMay2013 BP TOT Global Hotspots High Impact Wells Dry Plays Onshore Deepwater 13 FryklundANIMPMay2013 Technology Hotspots GTL – Planned/Under Construction Mini LNG – Planned/Under Construction GTL - Operating Mini LNG - Operating GTL – Deferred/Cancelled Floating LNG The Global Tight Oil Race Producing Scaling Up Pilots Frontier FryklundANIMPMay2013 15 Mega Projects Oil Sands Shale/Tight Oil US GOM Qatar LNG NW Shelf East Africa Pre-Salt Queensland 50 – 100 bil. 100 – 150 bil. 150 – 200 bil. > 200 bil. EPC – Capacity Issues Drive Delays Australia other Asia-Pacific Atlantic Middle East EPC Investments in Liquefaction facilities (US$ Bn) 30 Africa Russia & Caspian 25 Europe Med. & Middle East North America 20 Central America South America Asia-Pacific 15 21.9 10 17.5 17.4 15 10 5 8.2 3.7 0 20 0 11.8 5 Construction Delay ( Months) 25 1.0 1.3 0.9 1.4 2003 2004 2005 2006 2.5 2007 2008 2.6 2009 1.4 2010 2011 2012 2013 2014 2015 -5 -10 2000 2005 2010 Year of FID Construction delay = difference between online date at FID and actual or expected online date 17 FryklundANIMPMay2013 2015 Capex Costs Micro Bursts Brazil Upstream Cost Index Regional Upstream Indexes 600 500 400 Africa Asia Pac 300 Europe ME 200 Namerica Russia 250 SAGD Capital Cost Index 200 100 Latin America 0 150 2000 2003 Q1 2006 Q3 2007 Q1 2009 Q4 2009 Q3 2010 Q2 2011 Q1 2012 Q4 2012 2013 2016 100 FryklundANIMPMay2013 18 The Local Content Multiplier - Brazil Percent LC (percent) 0 50 100 Key Exploration and Development Activities Drilling & Development Production & Storage Units Topsides & Processing Equipment Higher initial expat input on (E&PM) is likely to increase cost Project Management Design Access, cost, and quality are key issues for local hull upgrade and requires infrastructure upgrade HUC Large turbine drive rotary equipment beyond local industry capabilities. Large pumps and compressors currently imported. Top side fabrication Piping Electrical Instruments Higher local content can be reached given scale and technology transfer Secondary Steel Controls Power Distribution Gas Compressors Turbine Drive Fine Filters Necessary to transfer capability/technology from other industries shouldn’t present a major hurdle CO2 Removal Power generation Gas Compressor elect drive Maximum LC Achievable With Current Local Capabilities Pump Turbine Drive Oil Export Pumps A steep change in technical capability likely to require large procurement commitment Heat Exchangers Utilities Vessels Installation 76 percent Higher local content is not a large capability/technology stretch here Moob/Demob & Towing Marine commissioning Tanker Project Mangement Tanker Design Mooring System Higher initial expat input on E&PM is likely to increase cost Hull Upgrade-Materials Hull Upgrade-Fabrication Source: IHS CERA. FPSO: Floating Production 19 Storage Offloading Vessel FryklundANIMPMay2013 Labor- Dealing with Peaks and Valleys 20 FryklundANIMPMay2013 The New Face of Risk FryklundKNOWApril23,2013 21 The Road Ahead • A Golden Era for Contracting ? • Something for Everyone – Up/ Mid/ Downstream ? • Mega projects- Diversity Continues • New Technologies - Game Changers ? • New Models of Cooperation FryklundANIMPMay2013 22 For more information about this presentation or IHS in general, please contact Bob Fryklund +1 713 369 0317 Bob.Fryklund@ihs.com Calgary Oslo Moscow San Francisco Denver Mexico City Cambridge, MA London Paris Beijing Tokyo Geneva Washington, DC Houston Dubai Bangkok Mumbai Bogota Singapore Rio de Janeiro Perth 55 Cambridge Parkway Cambridge, Massachusetts 02142, USA IHSCERA.com FryklundANIMPMay2013 23
